. 2018 Mar 1;200(5):1671-1681.
doi: 10.4049/jimmunol.1701578. Epub 2018 Jan 26.

CD22 Promotes B-1b Cell Responses to T Cell-Independent Type 2 Antigens

Affiliations

CD22 Promotes B-1b Cell Responses to T Cell-Independent Type 2 Antigens

Karen M Haas et al. J Immunol. .

Abstract

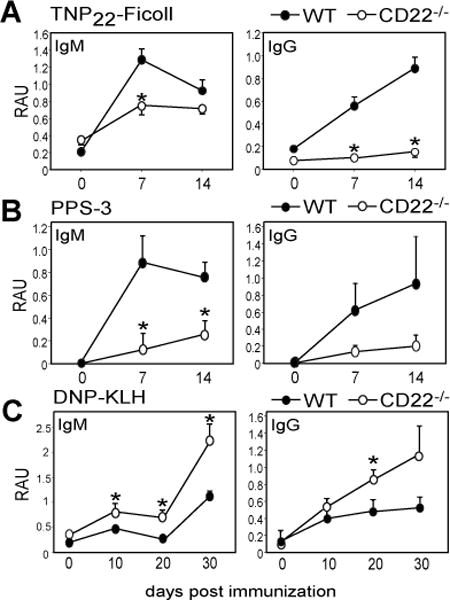
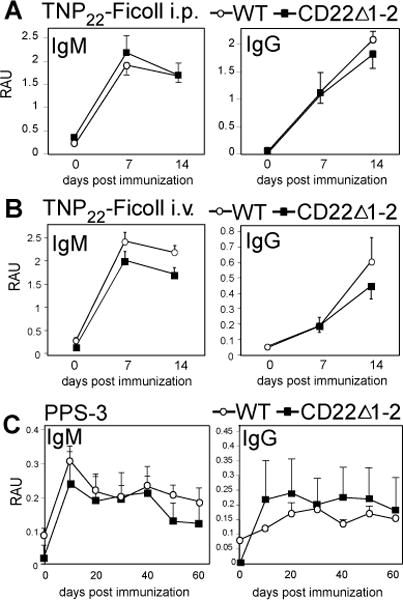
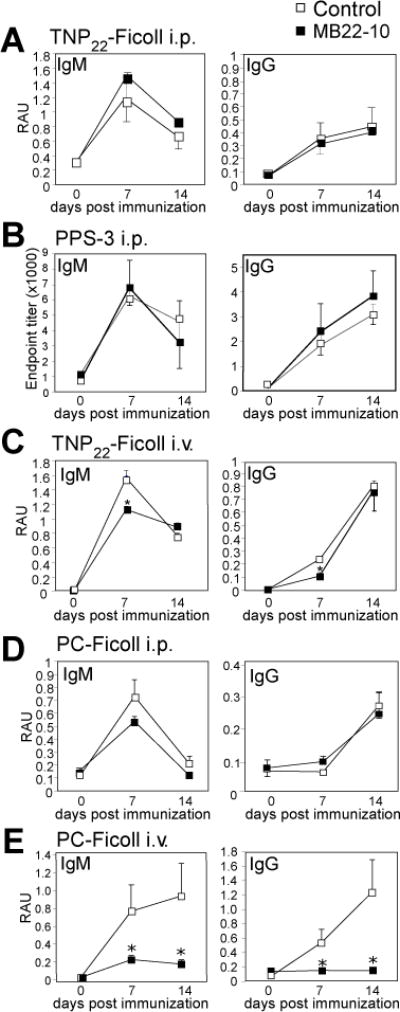
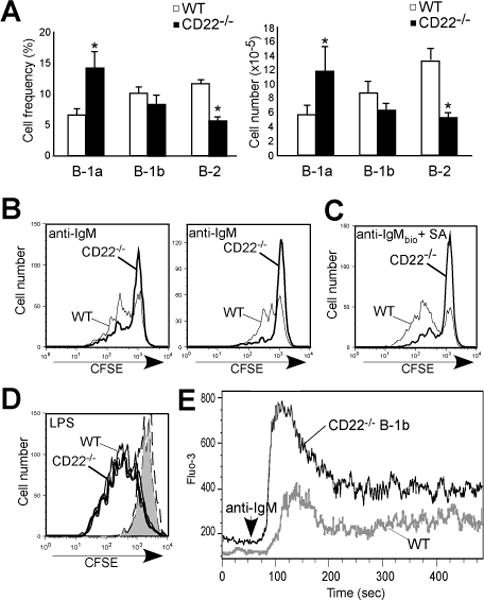
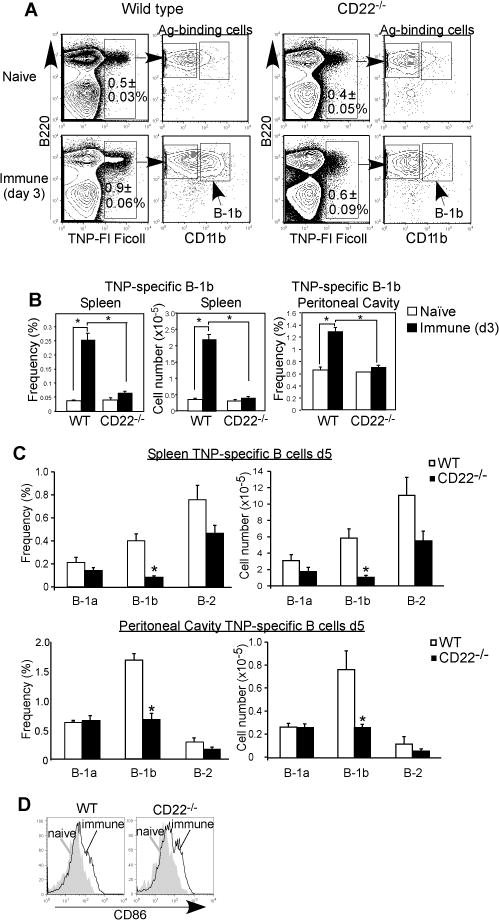
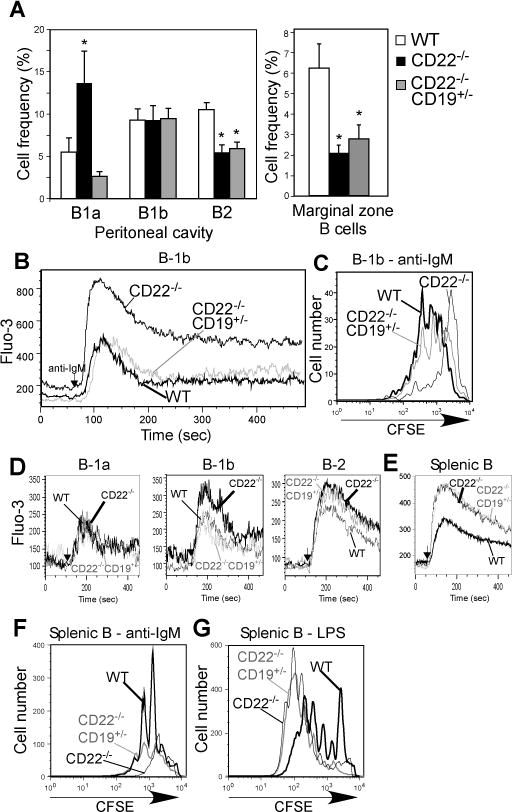
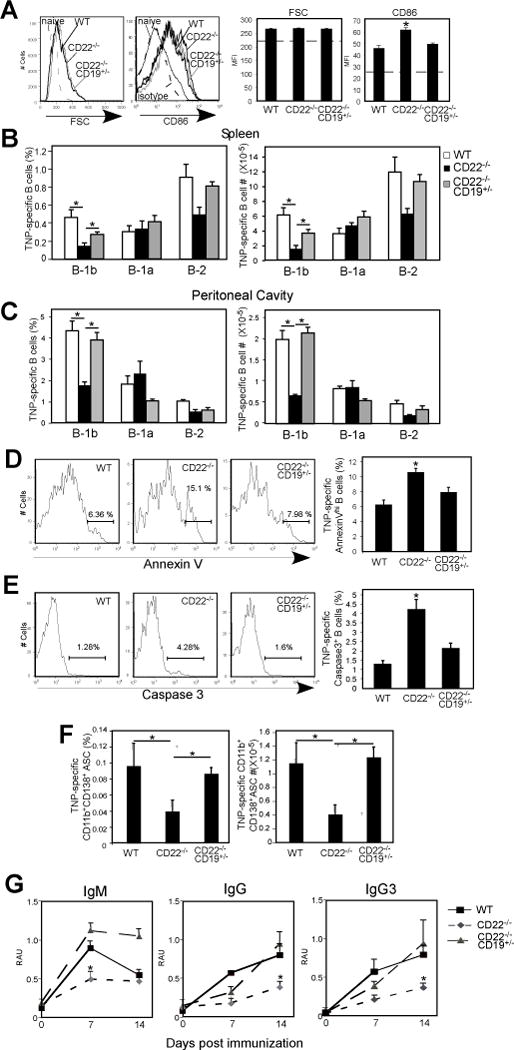
CD22 (Siglec-2) is a critical regulator of B cell activation and survival. CD22-/- mice generate significantly impaired Ab responses to T cell-independent type 2 (TI-2) Ags, including haptenated Ficoll and pneumococcal polysaccharides, Ags that elicit poor T cell help and activate BCR signaling via multivalent epitope crosslinking. This has been proposed to be due to impaired marginal zone (MZ) B cell development/maintenance in CD22-/- mice. However, mice expressing a mutant form of CD22 unable to bind sialic acid ligands generated normal TI-2 Ab responses, despite significantly reduced MZ B cells. Moreover, mice treated with CD22 ligand-binding blocking mAbs, which deplete MZ B cells, had little effect on TI-2 Ab responses. We therefore investigated the effects of CD22 deficiency on B-1b cells, an innate-like B cell population that plays a key role in TI-2 Ab responses. B-1b cells from CD22-/- mice had impaired BCR-induced proliferation and significantly increased intracellular Ca2+ concentration responses following BCR crosslinking. Ag-specific B-1b cell expansion and plasmablast differentiation following TI-2 Ag immunization was significantly impaired in CD22-/- mice, consistent with reduced TI-2 Ab responses. We generated CD22-/- mice with reduced CD19 levels (CD22-/-CD19+/-) to test the hypothesis that augmented B-1b cell BCR signaling in CD22-/- mice contributes to impaired TI-2 Ab responses. BCR-induced proliferation and intracellular Ca2+ concentration responses were normalized in CD22-/-CD19+/- B-1b cells. Consistent with this, TI-2 Ag-specific B-1b cell expansion, plasmablast differentiation, survival, and Ab responses were rescued in CD22-/-CD19+/- mice. Thus, CD22 plays a critical role in regulating TI-2 Ab responses through regulating B-1b cell signaling thresholds.


Figures

Figure 1
Figure 1. CD22−/− mice generate impaired Ab responses to TI-2 Ags, but augmented responses to a TD Ag
A) TNP-specific serum IgM, and IgG levels in WT and CD22−/− mice after immunization with 25 μg TNP22-Ficoll i.p. (RAU = relative absorbance units). B) PPS3-specific serum IgM and IgG levels in WT and CD22−/− mice after immunization with 1 μg PPS-3 i.p. C) DNP-specific serum IgM and IgG levels in WT and CD22−/− mice after immunization with 100 μg DNP-KLH i.p. on d0 and d21. Asterisks indicate significant differences in means (±SEM) between WT and CD22−/− mice (* p<0.05; n≥4 mice/group).
Figure 2
Figure 2. CD22Δ1-2 mice generate normal Ab responses to TI-2 Ags
A) TNP-specific serum IgM, and IgG levels in WT and CD22Δ1-2 mice after immunization with 25 μg TNP22-Ficoll i.p. B) TNP-specific serum IgM, and IgG levels in WT and CD22Δ1-2 mice after immunization with 25 μg TNP22-Ficoll i.v. C) PPS3-specific serum IgM and IgG levels in WT and CD22Δ1-2 mice after immunization with 1 μg PPS3 i.p. on d0 and d30.
Figure 3
Figure 3. A CD22 ligand blocking mAb has no effect on Ab responses to TNP-Ficoll or PPS3, but impairs Ab responses to PC-Ficoll delivered i.v
A) TNP-specific serum IgM, and IgG levels in WT mice administered 250 μg MB22-10 or IgG control mAb (i.p.) prior to immunization (d-1) with 25 μg TNP22-Ficoll i.p. B) PPS3-specific serum IgM and IgG levels in WT mice administered 250 μg MB22-10 or IgG control mAb (i.p.) with 1 μg PPS3 i.p. C) TNP-specific serum IgM, and IgG levels in WT mice administered 250 μg MB22-10 or IgG control mAb (i.p.) prior to immunization (d-1) with 25 μg TNP22-Ficoll i.v. D) PC-specific serum IgM, and IgG levels in WT mice administered 250 μg MB22-10 or IgG control mAb (i.p.) prior to immunization with 25 μg PC-Ficoll i.p. E) PC-specific serum IgM, and IgG levels in WT mice administered 250 μg MB22-10 or IgG control mAb (i.p.) prior to immunization with 25 μg PC-Ficoll i.v. Asterisks indicate significant differences in means (±SEM) between WT mice treated with MB22-10 and control IgG (* p<0.05).
Figure 4
Figure 4. CD22 regulates B-1b cell proliferation and calcium signaling
A) Frequencies and numbers of peritoneal B-1a, B-1b, and B-2 cells in WT and CD22−/− mice. Asterisks indicate significant differences in means (±SEM) between WT and CD22−/− mice (* p<0.05; n=9/group). B-C) CFSE-labeled peritoneal B-1b cells from WT and CD22−/− mice were cultured with 5 μg/ml goat anti-mouse IgM F(ab′)2 (B; 2 independent experiments shown) or 2.5 μg/ml goat anti-mouse IgM F(ab′)2 plus 5 μg/ml streptavidin (C) or LPS (D; 5 μg/ml) and analyzed for division by flow cytometry at day 4. Bold and thin lines indicate stimulated CD22−/− and WT B-1b cell proliferation, respectively. In D, the dashed line and gray filled histograms indicate unstimulated CD22−/− and WT B-1b cells. E) BCR-induced [Ca2+]i responses in peritoneal B-1b cells from wild type (WT) and CD22−/− mice. F(ab′)2 goat anti-mouse IgM Ab (5 μg/ml) was added to the cells after 1 min (arrowhead) with relative [Ca2+]i concentrations (indicated by Fluo-3 mean fluorescent intensity) assessed by flow cytometry. Results are representative of those obtained in 3 independent experiments.
Figure 5
Figure 5. CD22 promotes Ag-specific B-1b cell expansion in response to TI-2 Ag
A–B) In vivo expansion of TNP-specific spleen and peritoneal B cells in WT and CD22−/− mice 3 days following immunization with TNP52-Ficoll. A) Representative frequencies of TNP30-FITC-Ficoll-binding by splenic B220+ B cells from WT and CD22−/− mice before and 3 days after immunization. Left panels indicate gating of CD11b+ (B-1b cells). B) Frequencies and numbers of TNP-specific spleen and peritoneal B-1b cells before and 3 days after immunization. C) TNP-specific spleen and peritoneal B cell subset cell frequencies and numbers in WT and CD22−/− mice 5 days following immunization with TNP52-Ficoll as determined by flow cytometry with identification of TNP-specific B-1a (B220+CD5+CD11b+), B-1b (B220+CD11b+CD5), and B-2 (B220+CD11bCD5) cell subsets in WT and CD22−/− mice. D) Representative CD86 staining on TNP-specific spleen B-1b cells from naïve and immune WT and CD22−/− mice. Significant differences in mean values (±SEM) are indicated by asterisks; *, p<0.05 (n=3 naïve and n=5 immune mice/group).
Figure 6
Figure 6. Reduction in CD19 expression rescues proliferation and normalizes BCR-induced [Ca2+]i responses in CD22−/− B-1b cells
A) Frequencies of peritoneal B-1a, B-1b, and B-2 cells (n=5-6/group) and splenic marginal zone (n>8/group) B cells in WT, CD22−/−, and CD22−/−19+/− mice. Asterisks indicate significant differences in means (±SEM) between WT and CD22−/− mice and between WT and CD22−/−19+/− mice (* p<0.05). B) BCR-induced [Ca2+]i responses in peritoneal B-1b cells from WT, CD22−/− and CD22−/−CD19+/− mice. F(ab′)2 goat anti-mouse IgM Ab (5 μg/ml) was added to the cells after 1 min (arrowhead) with relative [Ca2+]i concentrations (indicated by Fluo-3 mean fluorescent intensity) assessed by flow cytometry. Results are representative of those obtained in 3 independent experiments. C) CFSE-labeled peritoneal B-1b cells from WT, CD22−/−, and CD22−/−CD19+/− mice were cultured with 5 μg/ml goat anti-mouse IgM F(ab′)2 and analyzed for division by flow cytometry at day 4. Results are representative of those obtained in 3 independent experiments. D-E) BCR-induced [Ca2+]i responses in peritoneal B-1a (B220+CD5+CD11b+), B-1b (B220+CD11b+CD5), and B-2 (B220+CD11bCD5) cell subsets (D) and spleen B220+ B cells (E) from WT, CD22−/−, and CD22−/−CD19+/− mice. F(ab′)2 goat anti-mouse IgM Ab (5 μg/ml) was added to the cells after 1 min (arrowhead) with relative [Ca2+]i concentrations (indicated by Fluo-3 mean fluorescent intensity) assessed by flow cytometry. Results are representative of those obtained in 3 or more experiments. F–G) CFSE-labeled CD43neg spleen B cells from WT, CD22−/−, and CD22−/−CD19+/− mice were cultured with 5 μg/ml goat anti-mouse IgM F(ab′)2 (F) or LPS (G) and analyzed for division by flow cytometry at day 4. Results are representative of those obtained in 3-4 independent experiments.
Figure 7
Figure 7. Reduction in CD19 expression rescues TI-2 Ag-specific B-1b cell expansion and plasmablast differentiation, reduces Ag-specific B cell apoptosis and restores TI-2 Ab responses CD22−/− mice
A–C) In vivo activation and expansion of TNP-specific B cells in WT, CD22−/− and CD22−/−CD19+/− mice 5 days following immunization with TNP52-Ficoll. A) Activation of TNP-specific B cells as measured by increased FSC and CD86 expression. Isotype control staining for TNP-specific B cells from immune WT mice is indicated for CD86 staining (dashed line). Dashed horizontal line in the bar graphs indicates naïve baseline values for TNP-specific B cells. Results from 3-4 mice/genotype. B-C) Frequencies and numbers of TNP-specific spleen (B) and peritoneal (C) B-1a, B-1b, and B-2 cells in immune (d5) WT, CD22−/− and CD22−/−CD19+/− mice (n=4-8/group). Populations were identified using the gating strategy shown in Supplemental Fig. 1E. D–E) Frequencies of Annexin Vhi (E) and caspase-3+ (E) cells among TNP-specific spleen B cells in WT, CD22−/− and CD22−/−CD19+/− mice 2 days following immunization (n=5-7 mice/group for Annexin V stain and 3-6 mice/group for caspase-3). F) Frequencies and numbers of CD138+B220+CD11b+ splenic TNP-specific B-1 cells 5 days post TNP-Ficoll immunization in WT, CD22−/− and CD22−/−CD19+/− mice. (G) TNP-specific serum IgM, and IgG levels in WT, CD22−/− and CD22−/−CD19+/− mice after immunization with 25 μg TNP22-Ficoll i.p. (n=4/group). Significant differences in mean values (±SEM) are indicated by asterisks; *, p<0.05, In B–F, one-way ANOVA with Tukey’s post-hoc test was used.

References

    1. Mehr S, Wood N. Streptococcus pneumoniae–a review of carriage, infection, serotype replacement and vaccination. Paediatric Resp Rev. 2012;13:258–64. - PubMed
    1. Vos Q, Lees A, Wu ZQ, Snapper CM, Mond JJ. B-cell activation by T-cell-independent type 2 antigens as an integral part of the humoral immune response to pathogenic microorganisms. Immunol Rev. 2000;176:154–170. - PubMed
    1. Gonzalez-Fernandez A, Faro J, Fernandez C. Immune responses to polysaccharides: lessons from humans and mice. Vaccine. 2008;26:292–300. - PubMed
    1. Weller S, Reynaud CA, Weill JC. Vaccination against encapsulated bacteria in humans: paradoxes. Trends Immunol. 2005;26:85–89. - PubMed
    1. Klein Klouwenberg P, Bont L. Neonatal and infantile immune responses to encapsulated bacteria and conjugate vaccines. Clin Dev Immunol. 2008;2008:628963. - PMC - PubMed

Publication types

MeSH terms

LinkOut - more resources