

Characterization of Conformational Ensembles of Protonated N-glycans in the Gas-Phase
- PMID: 29374210
- PMCID: PMC5786100
- DOI: 10.1038/s41598-018-20012-0
Characterization of Conformational Ensembles of Protonated N-glycans in the Gas-Phase
Abstract
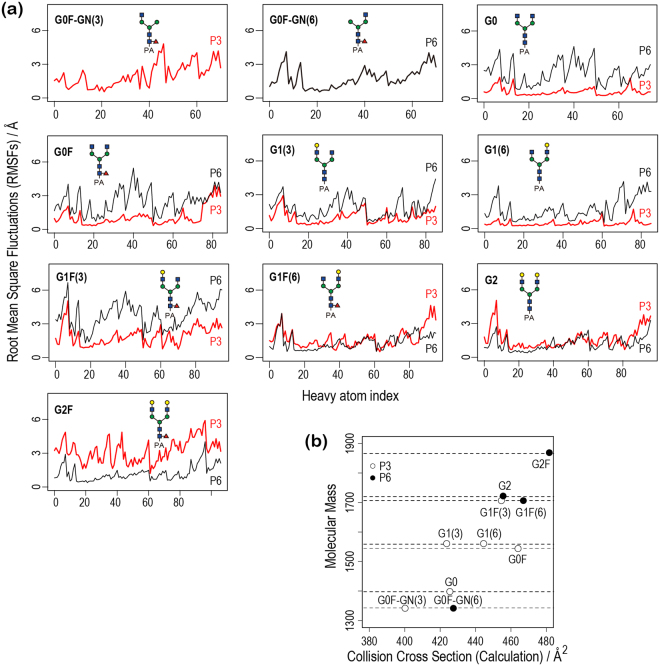
Ion mobility mass spectrometry (IM-MS) is a technique capable of investigating structural changes of biomolecules based on their collision cross section (CCS). Recent advances in IM-MS allow us to separate carbohydrate isomers with subtle conformational differences, but the relationship between CCS and atomic structure remains elusive. Here, we characterize conformational ensembles of gas-phase N-glycans under the electrospray ionization condition using molecular dynamics simulations with enhanced sampling. We show that the separation of CCSs between isomers reflects folding features of N-glycans, which are determined both by chemical compositions and protonation states. Providing a physicochemical basis of CCS for N-glycans helps not only to interpret IM-MS measurements but also to estimate CCSs of complex glycans.
Conflict of interest statement
The authors declare that they have no competing interests.
Figures


Similar articles
-
Collision Cross Sections and Ion Mobility Separation of Fragment Ions from Complex N-Glycans.J Am Soc Mass Spectrom. 2018 Jun;29(6):1250-1261. doi: 10.1007/s13361-018-1930-1. Epub 2018 Apr 19. J Am Soc Mass Spectrom. 2018. PMID: 29675741
-
Accurate Identification of Isomeric Glycans by Trapped Ion Mobility Spectrometry-Electronic Excitation Dissociation Tandem Mass Spectrometry.Anal Chem. 2020 Oct 6;92(19):13211-13220. doi: 10.1021/acs.analchem.0c02374. Epub 2020 Sep 11. Anal Chem. 2020. PMID: 32865981 Free PMC article.
-
Confident identification of isomeric N-glycan structures by combined ion mobility mass spectrometry and hydrophilic interaction liquid chromatography.Rapid Commun Mass Spectrom. 2012 Dec 30;26(24):2877-84. doi: 10.1002/rcm.6412. Rapid Commun Mass Spectrom. 2012. PMID: 23136018
-
Recent advances in ion mobility-mass spectrometry for improved structural characterization of glycans and glycoconjugates.Curr Opin Chem Biol. 2018 Feb;42:1-8. doi: 10.1016/j.cbpa.2017.10.007. Epub 2017 Nov 5. Curr Opin Chem Biol. 2018. PMID: 29080446 Free PMC article. Review.
-
Glycan analysis by ion mobility-mass spectrometry and gas-phase spectroscopy.Curr Opin Chem Biol. 2018 Feb;42:16-24. doi: 10.1016/j.cbpa.2017.10.021. Epub 2017 Nov 5. Curr Opin Chem Biol. 2018. PMID: 29107930 Review.
Cited by
-
A new approach for identifying positional isomers of glycans cleaved from monoclonal antibodies.Analyst. 2021 Jul 26;146(15):4789-4795. doi: 10.1039/d1an00780g. Analyst. 2021. PMID: 34231555 Free PMC article.
-
State Ensemble Energy Recognition (SEER): A Hybrid Gas-Phase Molecular Charge State Predictor.J Chem Inf Model. 2025 Jul 28;65(14):7507-7515. doi: 10.1021/acs.jcim.5c00980. Epub 2025 Jul 8. J Chem Inf Model. 2025. PMID: 40627554 Free PMC article.
-
The role of the mobile proton in fucose migration.Anal Bioanal Chem. 2019 Jul;411(19):4637-4645. doi: 10.1007/s00216-019-01657-w. Epub 2019 Mar 2. Anal Bioanal Chem. 2019. PMID: 30826852 Free PMC article.
-
Identification of Isomeric N-Glycans by Conformer Distribution Fingerprinting using Ion Mobility Mass Spectrometry.Chemistry. 2021 Jan 26;27(6):2149-2154. doi: 10.1002/chem.202004522. Epub 2021 Jan 14. Chemistry. 2021. PMID: 33047840 Free PMC article.
-
Structural Analysis of Oligosaccharides and Glycoconjugates Using NMR.Adv Neurobiol. 2023;29:163-184. doi: 10.1007/978-3-031-12390-0_6. Adv Neurobiol. 2023. PMID: 36255675
References
Publication types
MeSH terms
Substances
Grants and funding
LinkOut - more resources
Full Text Sources
Other Literature Sources
