. 2018 Jan 26;8(1):1686.
doi: 10.1038/s41598-018-20008-w.

Measuring dynamic social contacts in a rehabilitation hospital: effect of wards, patient and staff characteristics

Collaborators, Affiliations

Measuring dynamic social contacts in a rehabilitation hospital: effect of wards, patient and staff characteristics

Audrey Duval et al. Sci Rep. .

Erratum in

Abstract

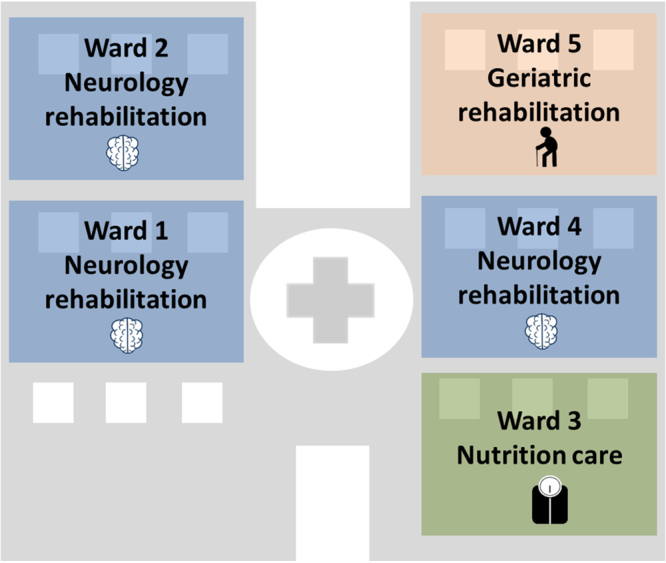
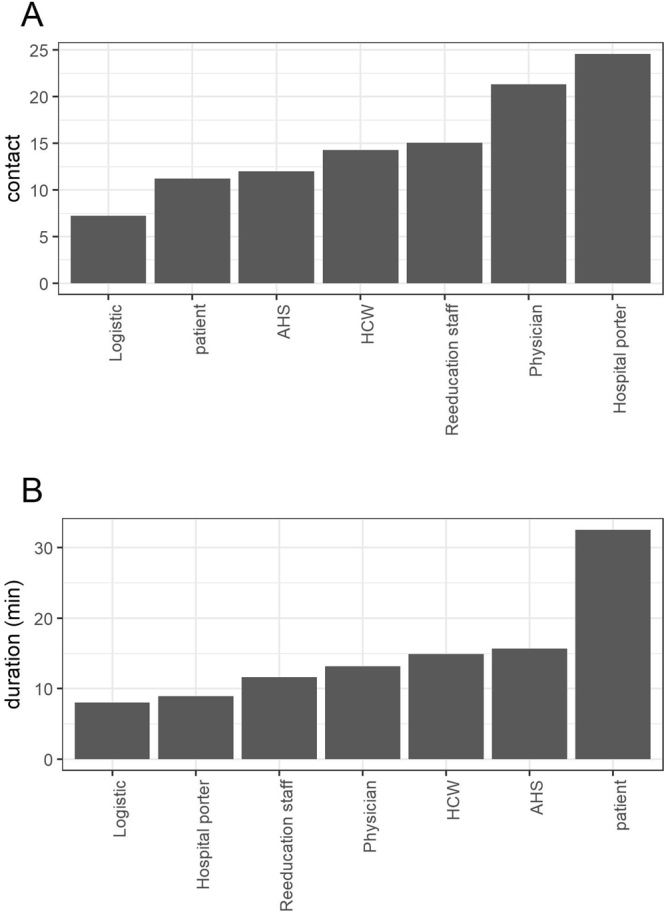
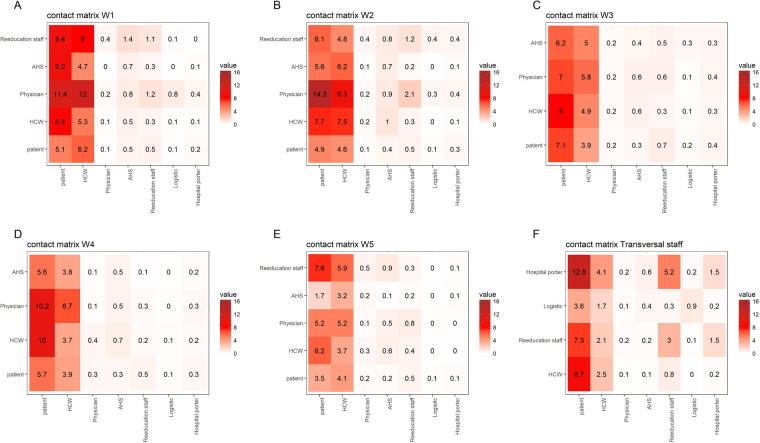
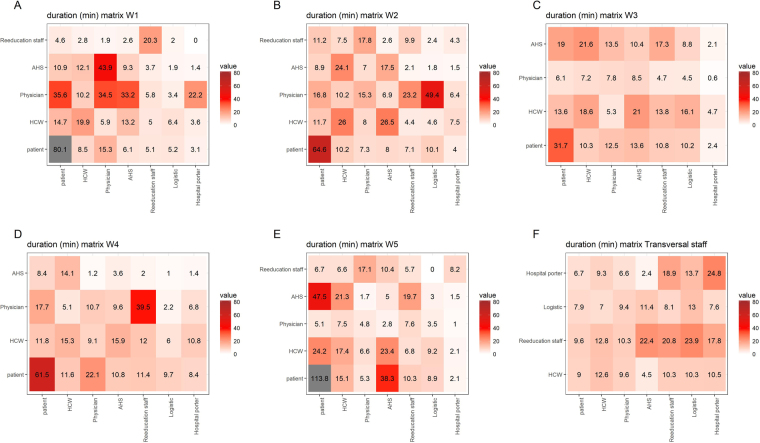
Understanding transmission routes of hospital-acquired infections (HAI) is key to improve their control. In this context, describing and analyzing dynamic inter-individual contact patterns in hospitals is essential. In this study, we used wearable sensors to detect Close Proximity Interactions (CPIs) among patients and hospital staff in a 200-bed long-term care facility over 4 months. First, the dynamic CPI data was described in terms of contact frequency and duration per individual status or activity and per ward. Second, we investigated the individual factors associated with high contact frequency or duration using generalized linear mixed-effect models to account for inter-ward heterogeneity. Hospital porters and physicians had the highest daily number of distinct contacts, making them more likely to disseminate HAI among individuals. Conversely, contact duration was highest between patients, with potential implications in terms of HAI acquisition risk. Contact patterns differed among hospital wards, reflecting varying care patterns depending on reason for hospitalization, with more frequent contacts in neurologic wards and fewer, longer contacts in geriatric wards. This study is the first to report proximity-sensing data informing on inter-individual contacts in long-term care settings. Our results should help better understand HAI spread, parameterize future mathematical models, and propose efficient control strategies.


Conflict of interest statement

The authors declare that they have no competing interests.

Figures

Figure 1
Figure 1
Organization of the Berck-sur-Mer hospital. The hospital is composed of five wards: 3 wards specialized in neurologic rehabilitation, 1 ward in geriatric rehabilitation and 1 ward in nutrition care.
Figure 2
Figure 2
Number of (A) daily distinct CPIs and (B) daily cumulative duration of CPIs, per category. Here, daily distinct CPIs represent, for individuals of each category, the average number of distinct individuals met over a day (Supplementary Text S1). Daily cumulative duration of CPIs represents, for each category, the average total duration two individuals spend in contact with each other over one day (Supplementary Text S1).
Figure 3
Figure 3
Ward-specific averaged daily distinct CPI frequency patterns between categories of individuals. Contact matrices are provided for (A) neurologic rehabilitation ward W1, (B) neurologic rehabilitation ward W2, (C) geriatric ward W3, (D) neurologic rehabilitation ward W4, (E) nutrition ward W5, and (F) individuals not attached to any ward (W6). Each cell represents the mean number of distinct individuals (see Supplementary Text S2) from a given category over the whole hospital (in columns) with whom someone from a category present in the ward (in rows) has a CPI.
Figure 4
Figure 4
Ward-specific averaged CPI daily cumulative duration patterns between categories of individuals. Duration matrices are provided for (A) neurologic rehabilitation ward W1, (B) neurologic rehabilitation ward W2, (C) geriatric ward W3, (D) neurologic rehabilitation ward W4, (E) nutrition ward W5, and (F) individuals not attached to any ward (W6). Each cell represents the mean daily cumulative duration of CPIs between categories (see Supplementary Text S2) present in the corresponding ward (rows) and categories present in the whole hospital (columns).
Figure 5
Figure 5
Time trends in CPIs over a 24-hour day. 5A: Boxplot of the distribution of hourly CPI frequencies for weekdays (pink box and red line) and weekend days (blue box and blue line). Blue and Red lines correspond to a GAM regression. 5B: median distinct hourly CPI frequency for patient-patient (red), staff-patient (green) and staff-staff (blue) CPIs for the study’s weeks.

References

    1. World Health Organization, (Who). Antimicrobial resistance. Global Report on Surveillance. Bulletin of the World Health Organization61 (2014).
    1. Vanhems P, Von Raesfeldt R, Ecochard R, Voirin N. Emergence of Ebola virus disease in a French acute care setting: A simulation study based on documented inter-individual contacts. Sci. Rep. 2016;6:1–7. doi: 10.1038/srep36301. - DOI - PMC - PubMed
    1. Read JM, Edmunds WJ, Riley S, Lessler J, Cummings DAT. Close encounters of the infectious kind: methods to measure social mixing behaviour. Epidemiol. Infect. 2012;140:2117–30. doi: 10.1017/S0950268812000842. - DOI - PMC - PubMed
    1. Mossong J, et al. Social contacts and mixing patterns relevant to the spread of infectious diseases. PLoS Med. 2008;5:0381–0391. doi: 10.1371/journal.pmed.0050074. - DOI - PMC - PubMed
    1. Smieszek T, et al. How should social mixing be measured: comparing web-based survey and sensor-based methods. BMC Infect. Dis. 2014;14:136. doi: 10.1186/1471-2334-14-136. - DOI - PMC - PubMed

Publication types