. 2018 Mar;12(3):728-741.
doi: 10.1038/s41396-017-0003-y. Epub 2018 Jan 26.

The impact of failure: unsuccessful bacterial invasions steer the soil microbial community away from the invader's niche

Affiliations

The impact of failure: unsuccessful bacterial invasions steer the soil microbial community away from the invader's niche

C A Mallon et al. ISME J. 2018 Mar.

Abstract

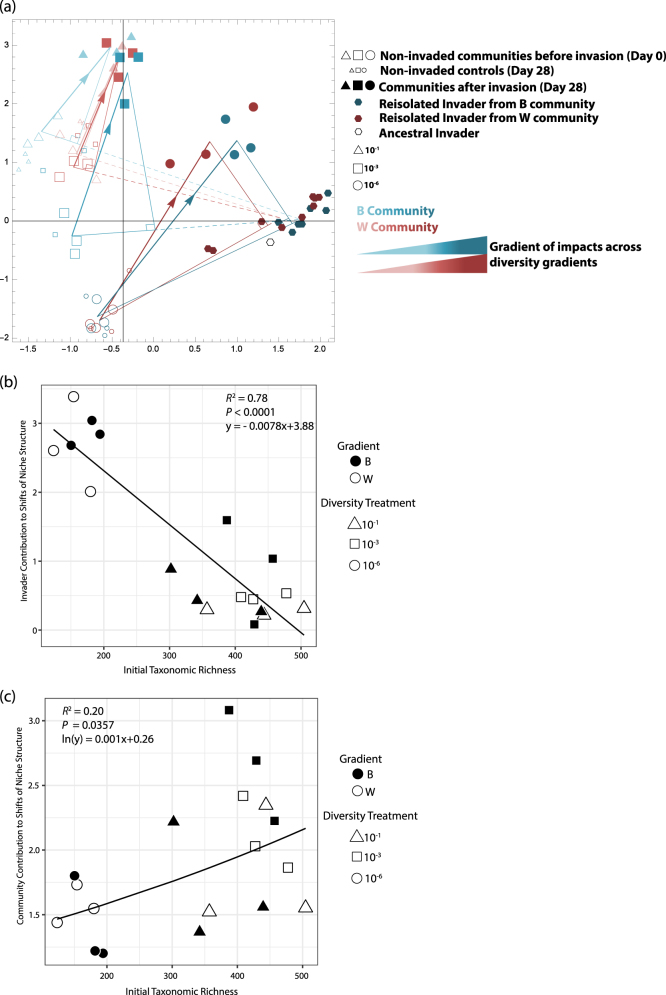
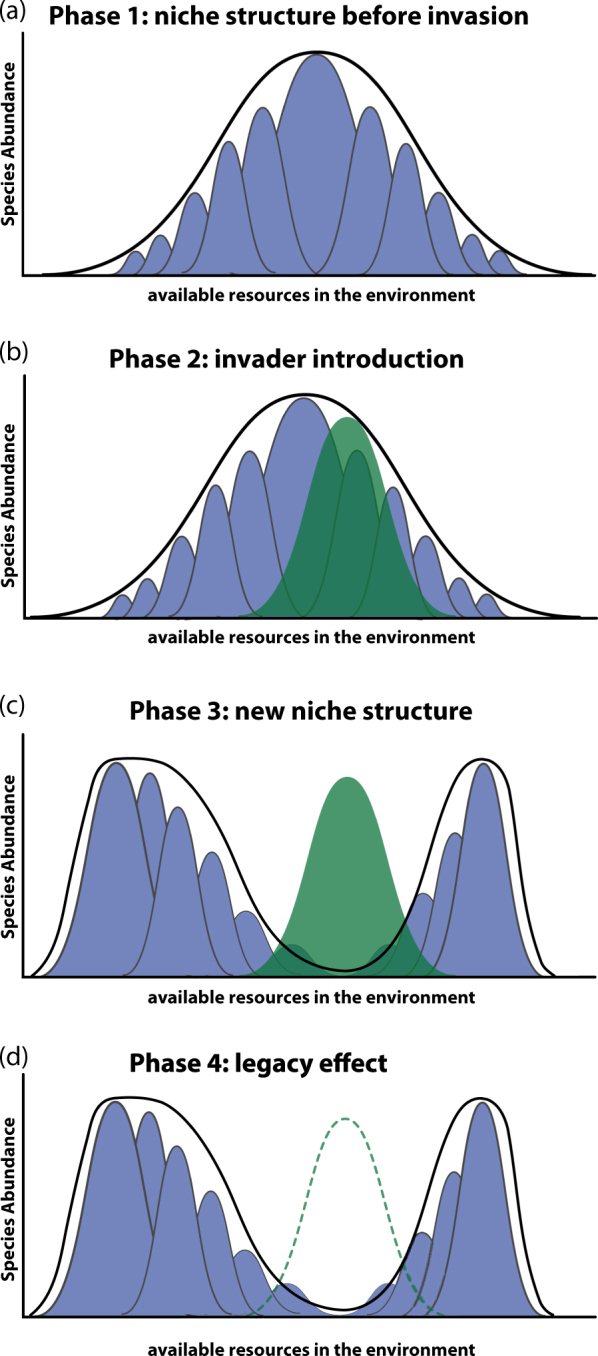
Although many environments like soils are constantly subjected to invasion by alien microbes, invaders usually fail to succeed, succumbing to the robust diversity often found in nature. So far, only successful invasions have been explored, and it remains unknown to what extent an unsuccessful invasion can impact resident communities. Here we hypothesized that unsuccessful invasions can cause impacts to soil functioning by decreasing the diversity and niche breadth of resident bacterial communities, which could cause shifts to community composition and niche structure-an effect that is likely exacerbated when diversity is compromised. To examine this question, diversity gradients of soil microbial communities were subjected to invasion by the frequent, yet oft-unsuccessful soil invader, Escherichia coli, and evaluated for changes to diversity, bacterial community composition, niche breadth, and niche structure. Contrary to expectations, diversity and niche breadth increased across treatments upon invasion. Community composition and niche structure were also altered, with shifts of niche structure revealing an escape by the resident community away from the invader's resources. Importantly, the extent of the escape varied in response to the community's diversity, where less diverse communities experienced larger shifts. Thus, although transient and unsuccessful, the invader competed for resources with resident species and caused tangible impacts that modified both the diversity and functioning of resident communities, which can likely generate a legacy effect that influences future invasion attempts.


Conflict of interest statement

The authors declare that they have no competing interests.

Figures

Fig. 1
Fig. 1. Decomposing and quantifying the contribution by the resident community and the invader to shifts of niche structure
. Vector µ1 is the movement of invaded communities in resource space. Vector µ2 corresponds to the contribution of the E. coli to the invaded community’s niche shift; this vector lies along an axis, vector e, which begins at the mean of communities before invasion and extends to the niche structure of the invader population, which is shown by the dashed green line extending away from vector µ2. Vector µ3 represents the contribution of the resident taxa to the invaded community’s niche shift
Fig. 2
Fig. 2. OTU richness increases while community composition shifts upon invasion
. (a) Observed OTU richness measured via 16S rRNA gene sequencing before (day 0) and after (day 28) invasion. Vertical bars represent the standard error of the mean (n = 3). Results of statistical tests are provided in Table 1. Comparison of community composition in the (b) B gradient and (c) W gradient before and after invasion across all treatments, as measured by examining their 16S rRNA gene structure with non-metric multidimensional scaling
Fig. 3
Fig. 3. Consistent increases and decreases of bacterial taxa abundances upon invasion
. (a) Increasing and (b) decreasing bacterial taxa abundances are indicated by overlaid bubble plots depicting a taxa’s relative percent abundance at day 0 (in green) or day 28 (in red). Bubbles are scaled by area to illustrate percent abundance. Each taxa name corresponds to an OTU and its closest related genus, order, or family
Fig. 4
Fig. 4. Community niche breadth increases upon invasion
. (a) Total community niche breadth and (b) community-exclusive niche breadth before invasion, after invasion, and in the non-invaded controls. Bars represent standard error of the mean (n = 3), and letters depict significant differences among diversity treatments
Fig. 5
Fig. 5. Invaded communities are steered away from the invader’s niche
. (a) is an ordination analysis visualizing the variation of the communities’ niche structures before and after invasion, and it contains vector information that teases apart the effects of the invader and of the resident taxa in regards to shifts of niche structure. Vectors with an arrow head indicate the total shift of communities upon invasion in resource space (equivalent to vector µ1 in Fig. 1). These vectors are decomposed into two orthogonal components, indicated as the legs of a right triangle. The first component of the community shift is due to the impact of the invader (solid portion of vector originating at a non-invaded community and pointing toward E. coli; this is equivalent to vector µ2 in Fig. 1); the second component reflects the response of the resident community (equivalent to vector µ3 in Fig. 1). The invader’s impact vector is continued with a dashed line merely to indicate the entire axis between non-invaded communities and the invader’s niche structure (equivalent to vector e in Fig. 1). The vectors µ2 and µ3 that were obtained separately for each treatment, are orthogonal in the 71-dimensional space of the carbon utilization profile data. Their projections onto the subspace spanned by the first two principal components (which capture 69.7% of the variation in the entire data set) are nearly orthogonal as well, implying that the dominant shifts in niche structure are consistent across treatments. The gradient of color, increasing from the most diverse to least diverse communities and terminating at the invader’s niche structure, indicates that impacts increase as diversity decreases. The least diverse, 10−6 communities are the most impacted and thus have the darkest color. (b) The vector quantifying the impact of the invader to niche shifts or (c) the vector quantifying the response and contribution of resident taxa to niche shifts are regressed with the initial OTU richness of the community
Fig. 6
Fig. 6. A conceptual model for understanding an invasion’s impacts and the creation of a legacy
. Consider a community of eleven taxa, each taxa’s population dominant on one of eleven resources, as shown in (a) where the height of each peak represents the abundance of that taxa in the community. The thick black line indicates the entire niche of the native community. (b) When an invader (green peak) is introduced into the community, a zone of competition is created as the invader and resident taxa compete for resources of similar preference. (c) Due to its initial high population size, the invader will manage to outcompete resident taxa in this zone of competition, and alter the niche structure in such a way that residents escape to occupy niches on which the invader has little or no competitive advantage. (d) Even if the invader is eventually eliminated from the community (dashed green line), perhaps due to abiotic, predatory, or antagonistic effects, it will have left a legacy to the community’s niche structure that could influence future invasions of the same or similar invaders

References

    1. Mack MC, D’Antonio CM. Impacts of biological invasions on disturbance regimes. Trends Ecol Evol. 1998;13:195–8. doi: 10.1016/S0169-5347(97)01286-X. - DOI - PubMed
    1. Stuart YE, Campbell TS, Hohenlohe PA, Reynolds RG, Revell LJ, Losos JB. Rapid evolution of a native species following invasion by a congener. Science. 2014;346:463–6. doi: 10.1126/science.1257008. - DOI - PubMed
    1. Kumschick S, Gaertner M, Vilà M, Essl F, Jeschke JM, Pyšek P, et al. Ecological impacts of alien species: quantification, scope, caveats, and recommendations. Bioscience. 2014;65:55–63. doi: 10.1093/biosci/biu193. - DOI
    1. Bradley BA, Blumenthal DM, Wilcove DS, Ziska LH. Predicting plant invasions in an era of global change. Trends Ecol Evol. 2010;25:310–8. doi: 10.1016/j.tree.2009.12.003. - DOI - PubMed
    1. Elton C. Ecology of Invasions by Animals and Plants. US: Springer; 1958.

Publication types