. 2018 Jan 27;19(1):19.
doi: 10.1186/s12882-018-0818-4.

Epoetin beta pegol for treatment of anemia ameliorates deterioration of erythrocyte quality associated with chronic kidney disease

Affiliations

Epoetin beta pegol for treatment of anemia ameliorates deterioration of erythrocyte quality associated with chronic kidney disease

Ken Aizawa et al. BMC Nephrol. .

Abstract

Background: Epoetin beta pegol (continuous erythropoietin receptor activator; C.E.R.A.) is currently widely used for the treatment of anemia associated with chronic kidney disease (CKD). Therapeutic control of anemia is assessed by monitoring haemoglobin (Hb) levels. However, certain qualitative aspects of erythrocytes are also impaired in CKD, including loss of deformability and shortened life-span. Therefore, monitoring Hb alone could potentially fail to reveal pathological changes in erythrocytes. Focusing on erythrocyte quality in CKD may lead to more effective anemia therapy with C.E.R.A.

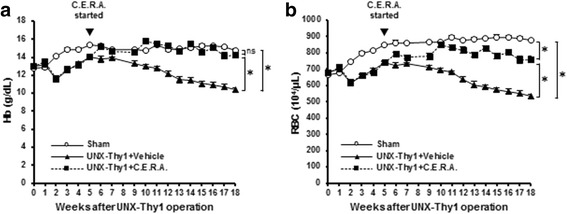
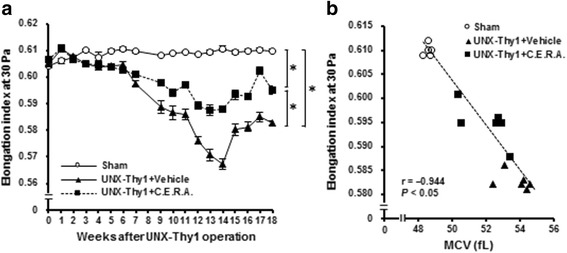
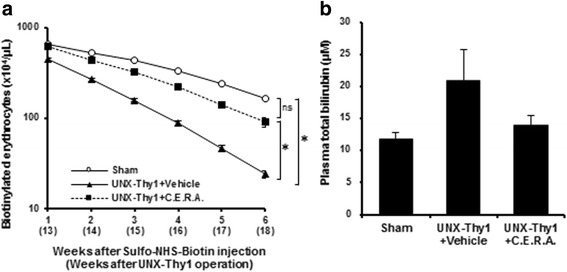
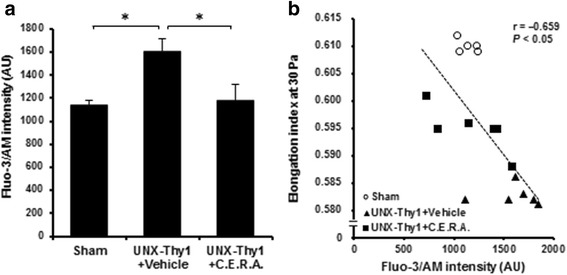
Methods: A CKD rat model was induced by uninephrectomy followed by anti-Thy1.1 antibody injection. From 5 weeks after the operation, C.E.R.A. (0.6 μg/kg) or vehicle was administered every 2 weeks. Erythrocyte deformability was quantified with ektacytometry and erythrocyte turnover was estimated by biotin labeling. Intracellular calcium level was assessed by Fluo-3/AM.

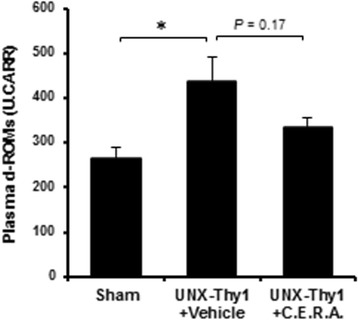
Results: Erythrocyte deformability progressively declined in CKD rats. Furthermore, erythrocyte turnover in the circulation drastically accelerated in CKD rats. With administration of C.E.R.A. at a dose sufficient to adequately control Hb, deterioration of erythrocyte deformability and turnover in CKD rats were significantly improved. Intracellular calcium, which plays a pivotal role in the mediation of erythrocyte quality, was significantly increased in CKD and was normalized by C.E.R.A.

Conclusion: C.E.R.A. treatment exerted a favorable effect not only on anemia but also on the improvement of erythrocyte quality. C.E.R.A. administered for the treatment of CKD-associated anemia may confer therapeutic benefits on erythrocytes.

Keywords: Anemia; Chronic kidney disease (CKD); Epoetin beta pegol (C.E.R.A.); Erythrocyte deformability; Erythrocyte turnover; Hematopoiesis; Intracellular calcium.


Conflict of interest statement

Ethics approval

This study is a non-clinical research. All animal procedures and experimental protocols were approved by the Institutional Animal Care and Use Committee at Chugai Pharmaceutical Co., Ltd., and conformed to the Guide for the Care and Use of Laboratory Animals published by Institution of Laboratory Animal Resources (ILAR).

Consent for publication

Not applicable (no individual person’s data).

Competing interests

The authors declare that they have no competing interests.

Publisher’s Note

Springer Nature remains neutral with regard to jurisdictional claims in published maps and institutional affiliations.

Figures

Fig. 1
Fig. 1
Time course of Hb and RBC count. Hb levels (a) and RBC numbers (b) progressively and significantly decreased in the UNX-Thy1 + Vehicle group compared with levels in the Sham group. a C.E.R.A. treatment in the UNX-Thy1 group significantly increased Hb to levels nearly the same as those in the Sham group. b RBC number was also significantly increased by C.E.R.A. treatment in the UNX-Thy1 group. Values are shown as mean ± SEM. *, P < 0.05 (a, b, two-way ANOVA followed by Tukey’s test). Sham, n = 5; UNX-Thy1 + Vehicle, n = 6; UNX-Thy1 + C.E.R.A., n = 6
Fig. 2
Fig. 2
Plasma oxidative stress. The level of d-ROMs was significantly increased in the plasma of the UNX-Thy1 + Vehicle group compared with the Sham group. C.E.R.A. treatment in the UNX-Thy1 group tended to decrease the levels of plasma d-ROMs. Values are shown as mean ± SEM. *, P < 0.05 (Tukey’s test). Sham, n = 5; UNX-Thy1 + Vehicle, n = 6; UNX-Thy1 + C.E.R.A., n = 6
Fig. 3
Fig. 3
Erythrocyte deformability. Erythrocyte deformability is shown as the value of the elongation index. a Compared with the stable erythrocyte deformability status in the Sham group, erythrocytes in the UNX-Thy1 + Vehicle group showed a significant deterioration of deformability. C.E.R.A. treatment in UNX-Thy1 group significantly improved erythrocyte deformability. b A significant negative correlation was observed between MCV and erythrocyte deformability. Values are shown as mean ± SEM. *, P < 0.05 (a, two-way ANOVA followed by Tukey’s test; b, Pearson’s correlation test). Sham, n = 5; UNX-Thy1 + Vehicle, n = 6; UNX-Thy1 + C.E.R.A., n = 6
Fig. 4
Fig. 4
Erythrocyte turnover. a Biotinylated erythrocytes significantly decreased in the UNX-Thy1 + Vehicle group compared with in the Sham group. C.E.R.A. treatment in the UNX-Thy1 group significantly suppressed the decrease in biotinylated erythrocytes in circulation. b Although there was no statistical significance, total bilirubin in the plasma of the UNX-Thy1 + Vehicle group tended to increase compared with that in the Sham group. C.E.R.A. treatment in the UNX-Thy1 group tended to decrease plasma total bilirubin. Values are shown as mean ± SEM. *, P < 0.05 (a, two-way ANOVA followed by Tukey’s test; b, Tukey’s test). Sham, n = 5; UNX-Thy1 + Vehicle, n = 6; UNX-Thy1 + C.E.R.A., n = 6
Fig. 5
Fig. 5
Intracellular calcium level in erythrocytes. a Intracellular calcium level as assessed by Fluo-3/AM intensity was significantly increased in erythrocytes in the UNX-Thy1 + Vehicle group compared with those in the Sham group. C.E.R.A. treatment in the UNX-Thy1 group significantly decreased intracellular calcium level to nearly the same level as in the Sham group. b A significant negative correlation was observed between intracellular calcium level in erythrocytes and erythrocyte deformability. Values are shown as mean ± SEM. *, P < 0.05 (a, Tukey’s test; b, Pearson’s correlation test). Sham, n = 5; UNX-Thy1 + Vehicle, n = 6; UNX-Thy1 + C.E.R.A., n = 6

Similar articles

Cited by

References

    1. Locatelli F, Reigner B. C.E.R.A.: pharmacodynamics, pharmacokinetics and efficacy in patients with chronic kidney disease. Expert Opin Investig Drugs. 2007;16:1649–1661. doi: 10.1517/13543784.16.10.1649. - DOI - PubMed
    1. Kikuchi Y, Koyama T, Koyama Y, Tozawa S, Arai T, Horimoto M, et al. Red blood cell deformability in renal failure. Nephron. 1982;30:8–14. doi: 10.1159/000182424. - DOI - PubMed
    1. Lee S, Lee MY, Nam JS, Kang S, Park JS, Shin S, et al. Hemorheological approach for early detection of chronic kidney disease and diabetic nephropathy in type 2 diabetes. Diabetes Technol Ther. 2015;17:808–815. doi: 10.1089/dia.2014.0295. - DOI - PubMed
    1. Shaw AB. Haemolysis in chronic renal failure. Br Med J. 1967;2:213–216. doi: 10.1136/bmj.2.5546.213. - DOI - PMC - PubMed
    1. Vos FE, Schollum JB, Coulter CV, Doyle TC, Duffull SB, Walker RJ. Red blood cell survival in long-term dialysis patients. Am J Kidney Dis. 2011;58:591–598. doi: 10.1053/j.ajkd.2011.03.031. - DOI - PubMed

Substances