

Food-induced reinforcement is abrogated by the genetic deletion of the MT1 or MT2 melatonin receptor in C3H/HeN mice
- PMID: 29374562
- PMCID: PMC5842708
- DOI: 10.1016/j.bbr.2018.01.027
Food-induced reinforcement is abrogated by the genetic deletion of the MT1 or MT2 melatonin receptor in C3H/HeN mice
Abstract
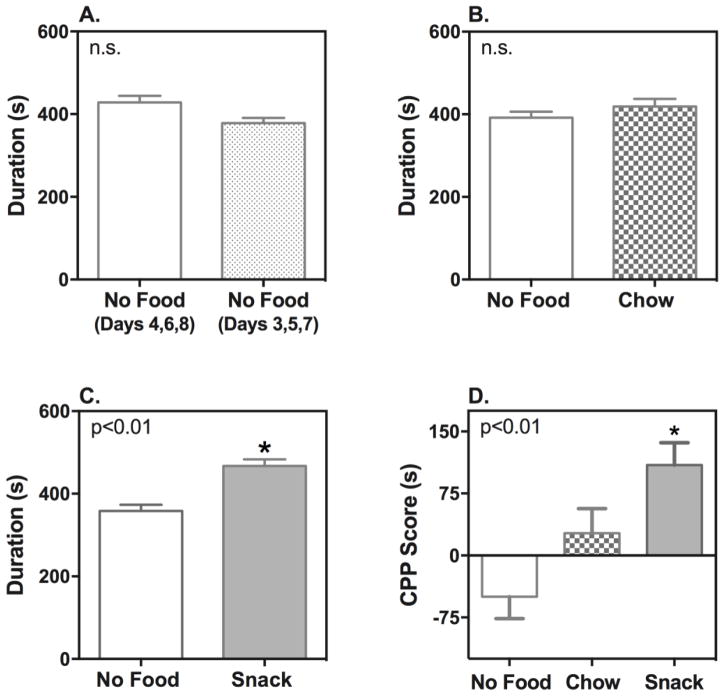
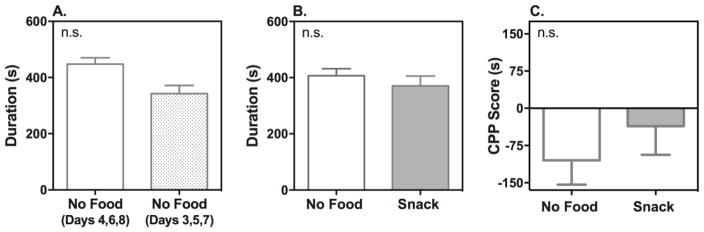
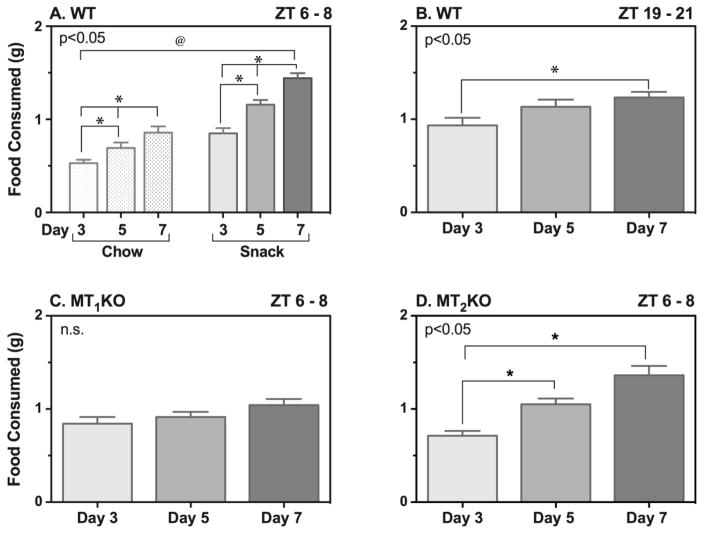
Palatable food is known for its ability to enhance reinforcing responses. Studies have suggested a circadian variation in both drug and natural reinforcement, with each following its own time course. The goal of this study was to determine the role of the MT1 and MT2 melatonin receptors in palatable snack food-induced reinforcement, as measured by the conditioned place preference (CPP) paradigm during the light and dark phases. C3H/HeN wild-type mice were trained for snack food-induced CPP at either ZT 6 - 8 (ZT: Zeitgeber time; ZT 0 = lights on), when endogenous melatonin levels are low, or ZT 19 - 21, when melatonin levels are high. These time points also correspond to the high and low points for expression of the circadian gene Period1, respectively. The amount of snack food (chow, Cheetos®, Froot Loops® and Oreos®) consumed was of similar magnitude at both times, however only C3H/HeN mice conditioned to snack food at ZT 6 - 8 developed a place preference. C3H/HeN mice with a genetic deletion of either the MT1 (MT1KO) or MT2 (MT2KO) receptor tested at ZT 6 - 8 did not develop a place preference for snack food. Although the MT2KO mice showed a similar amount of snack food consumed when compared to wild-type mice, the MT1KO mice consumed significantly less than either genotype. We conclude that in our mouse model snack food-induced CPP is dependent on time of day and the presence of the MT1 or MT2 receptors, suggesting a role for melatonin and its receptors in snack food-induced reinforcement.
Keywords: C3H/HeN mouse; Conditioned place preference; MT(1) or MT(2) knockout mice; Melatonin; Melatonin receptors.
Copyright © 2018 Elsevier B.V. All rights reserved.
Conflict of interest statement
The authors declare no conflict of interest.
Figures


Similar articles
-
Genetic deletion of the MT1 or MT2 melatonin receptors abrogates methamphetamine-induced reward in C3H/HeN mice.Physiol Behav. 2014 Jun 10;132:79-86. doi: 10.1016/j.physbeh.2014.04.049. Epub 2014 May 9. Physiol Behav. 2014. PMID: 24813704 Free PMC article.
-
The antidepressant-like effect of the melatonin receptor ligand luzindole in mice during forced swimming requires expression of MT2 but not MT1 melatonin receptors.J Pineal Res. 2005 Sep;39(2):170-7. doi: 10.1111/j.1600-079X.2005.00233.x. J Pineal Res. 2005. PMID: 16098095
-
The endogenous melatonin (MT) signal facilitates reentrainment of the circadian system to light-induced phase advances by acting upon MT2 receptors.Chronobiol Int. 2012 May;29(4):415-29. doi: 10.3109/07420528.2012.667859. Epub 2012 Apr 10. Chronobiol Int. 2012. PMID: 22489607
-
Melatonin, Melatonin Receptors and Sleep: Moving Beyond Traditional Views.J Pineal Res. 2024 Oct;76(7):e13011. doi: 10.1111/jpi.13011. J Pineal Res. 2024. PMID: 39400423 Review.
-
[Sites and mechanisms of action of melatonin in mammals: the MT1 and MT2 receptors].J Soc Biol. 2007;201(1):85-96. doi: 10.1051/jbio:2007010. J Soc Biol. 2007. PMID: 17762828 Review. French.
Cited by
-
Adrenal MT1 melatonin receptor expression is linked with seasonal variation in social behavior in male Siberian hamsters.Horm Behav. 2022 Feb;138:105099. doi: 10.1016/j.yhbeh.2021.105099. Epub 2021 Dec 15. Horm Behav. 2022. PMID: 34920297 Free PMC article.
-
The Role of the Melatoninergic System in Circadian and Seasonal Rhythms-Insights From Different Mouse Strains.Front Physiol. 2022 Apr 12;13:883637. doi: 10.3389/fphys.2022.883637. eCollection 2022. Front Physiol. 2022. PMID: 35492605 Free PMC article. Review.
References
-
- Flegal KM, Carroll MD, Ogden CL, Curtin LR. Prevalence and trends in obesity among US adults, 1999–2008. JAMA. 2010;303(3):235–41. - PubMed
-
- Wang GJ, Volkow ND, Thanos PK, Fowler JS. Similarity between obesity and drug addiction as assessed by neurofunctional imaging: a concept review. J Addict Dis. 2004;23(3):39–53. - PubMed
Publication types
MeSH terms
Substances
Grants and funding
LinkOut - more resources
Full Text Sources
Other Literature Sources
Molecular Biology Databases
Research Materials
