. 2019 Mar;68(3):533-546.
doi: 10.1136/gutjnl-2017-314107. Epub 2018 Jan 27.

Non-parenchymal TREM-2 protects the liver from immune-mediated hepatocellular damage

Affiliations

Non-parenchymal TREM-2 protects the liver from immune-mediated hepatocellular damage

Maria J Perugorria et al. Gut. 2019 Mar.

Abstract

Objective: Liver injury impacts hepatic inflammation in part via Toll-like receptor (TLR) signalling. Triggering receptor expressed on myeloid cells 2 (TREM-2) modulates TLR4-mediated inflammation in bone marrow (BM)-derived macrophages but its function in liver injury is unknown. Here we hypothesised that the anti-inflammatory effects of TREM-2 on TLR signalling may limit hepatic injury.

Design: TREM-2 expression was analysed in livers of humans with various forms of liver injury compared with control individuals. Acute and chronic liver injury models were performed in wild type and Trem-2-/- mice. Primary liver cells from both genotypes of mice were isolated for in vitro experiments.

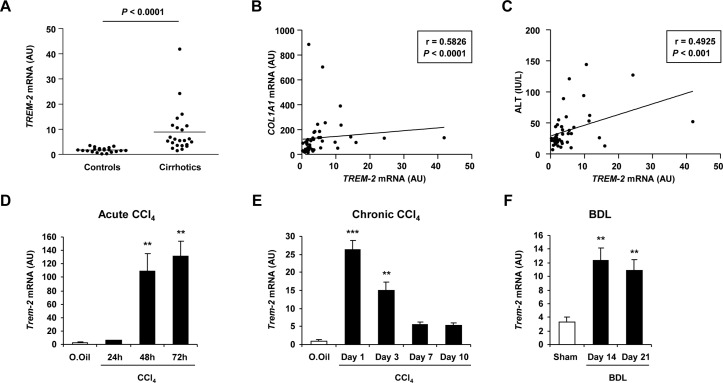
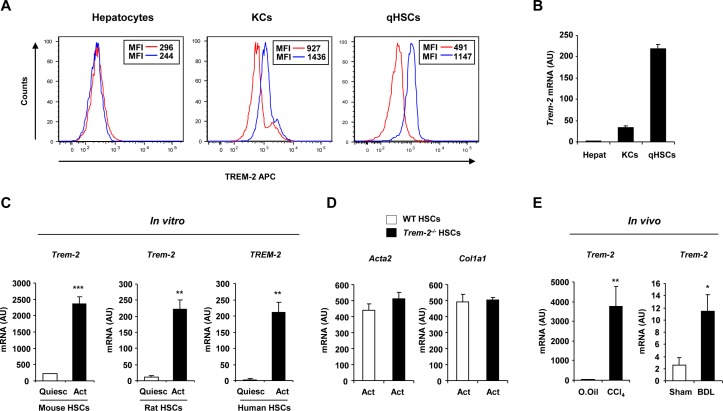
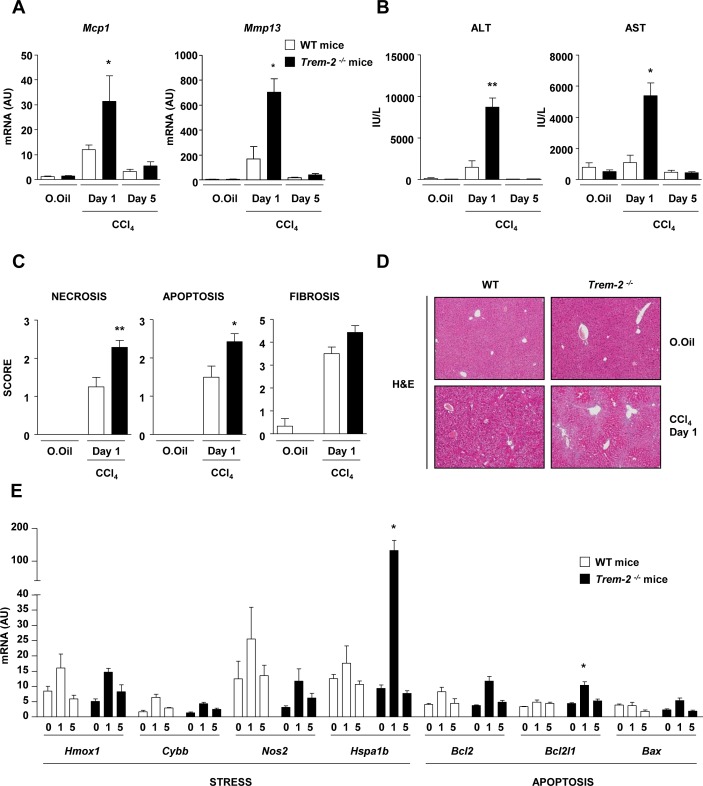
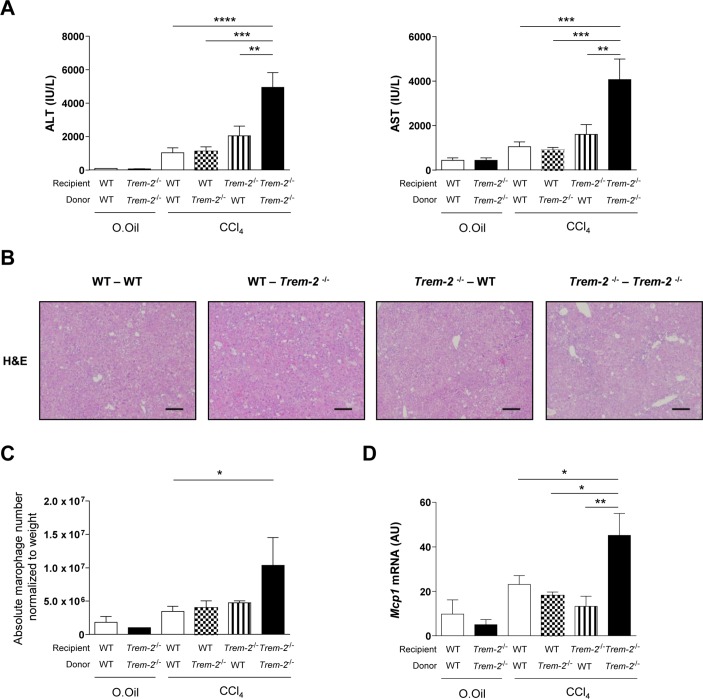
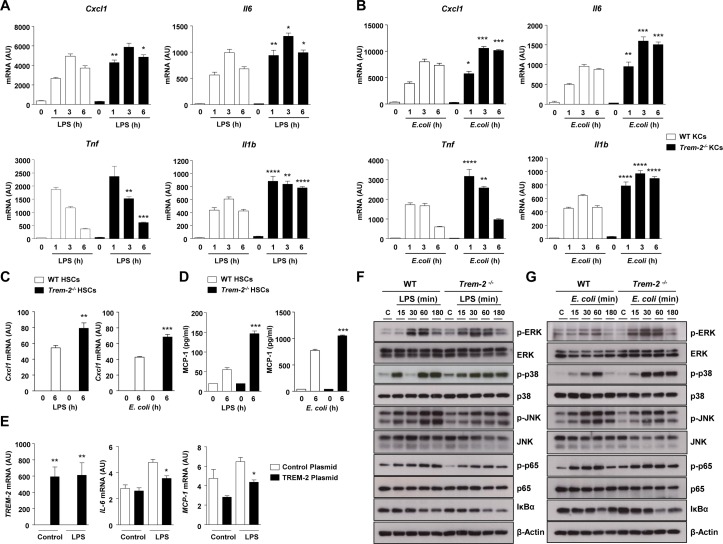
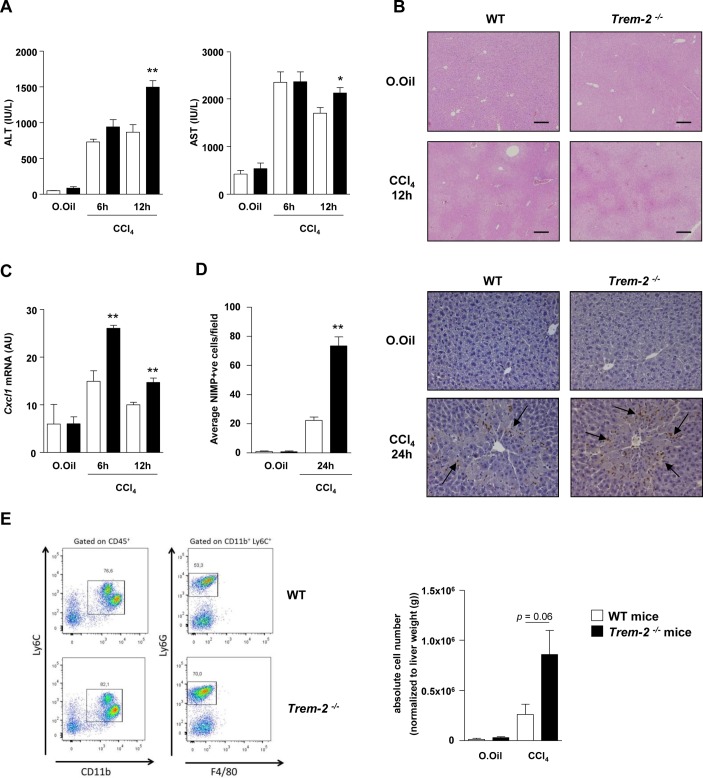
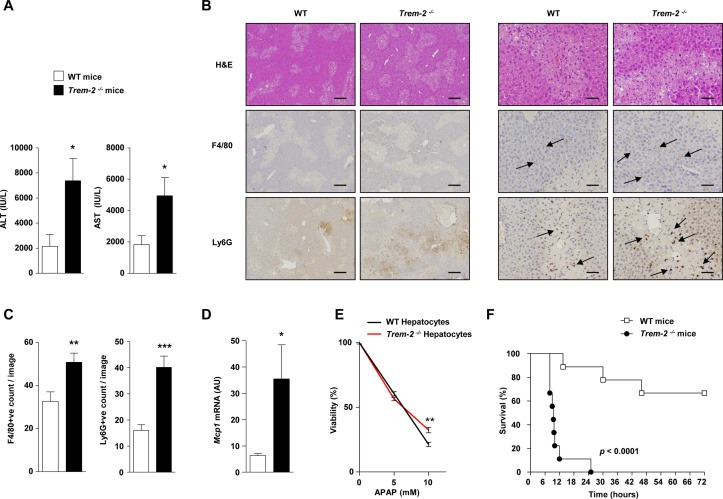
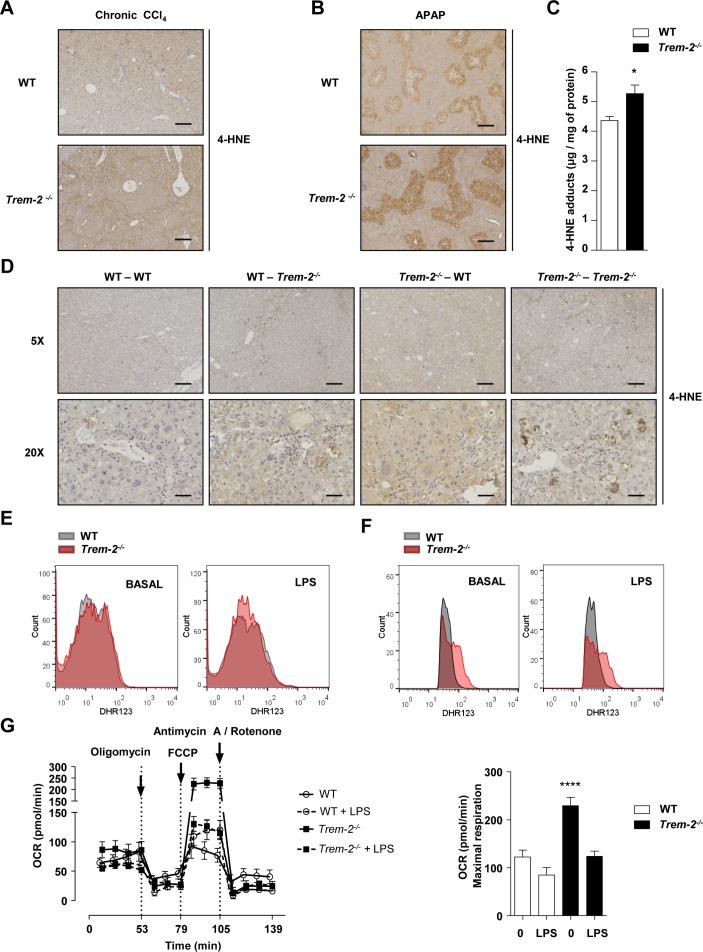
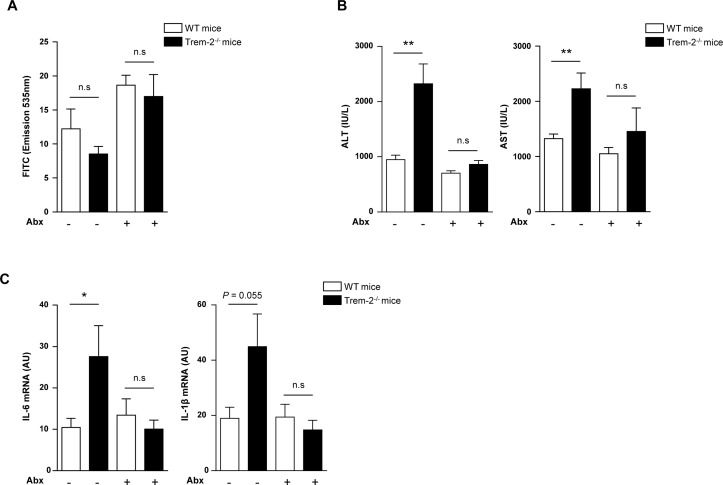
Results: TREM-2 was expressed on non-parenchymal hepatic cells and induced during liver injury in mice and man. Mice lacking TREM-2 exhibited heightened liver damage and inflammation during acute and repetitive carbon tetrachloride and acetaminophen (APAP) intoxication, the latter of which TREM-2 deficiency was remarkably associated with worsened survival. Liver damage in Trem-2-/- mice following chronic injury and APAP challenge was associated with elevated hepatic lipid peroxidation and macrophage content. BM transplantation experiments and cellular reactive oxygen species assays revealed effects of TREM-2 in the context of chronic injury depended on both immune and resident TREM-2 expression. Consistent with effects of TREM-2 on inflammation-associated injury, primary hepatic macrophages and hepatic stellate cells lacking TREM-2 exhibited augmented TLR4-driven proinflammatory responses.

Conclusion: Our data indicate that by acting as a natural brake on inflammation during hepatocellular injury, TREM-2 is a critical regulator of diverse types of hepatotoxic injury.

Keywords: acute liver failure; chronic liver disease; hepatic stellate cell; immune-mediated liver damage; inflammation.


Conflict of interest statement

Competing interests: None declared.

Figures

Figure 1
Figure 1
Expression of TREM-2 during human and mouse liver disease. (A) qRT-PCR analysis of TREM-2 expression in normal human liver (controls) and cirrhotic samples. (B,C) Correlation between TREM-2 and COL1A1 levels (B) or ALT (C). n=21 controls and 23 cirrhotic livers. (D) qRT-PCR of Trem-2 expression in livers of mice after the indicated acute CCl4 time points. Olive oil treated mice were used as controls. n=3 mice per condition and time point. (E,F) Trem-2 mRNA expression in the liver of mice treated with CCl4 for 12 weeks and sacrificed 1, 3, 7 or 10 days after the last CCl4 injection (E) and 14 or 21 days after BDL (F). n=3–5 (E) and 4–5 mice per time point (F). Statistical analysis used was Mann Whitney test (A) and non-parametric Spearman’s correlation test (B,C). Data represent mean±SEM and **,*** denote a P value of ˂0.01 and ˂0.001, respectively versus olive oil (D,E) or sham (F) determined using one-way analysis of variance, followed by Tukey’s posthoc test. ALT, alanine aminotransferase; BDL, bile duct ligation; CCl4, carbon tetrachloride; TREM, triggering receptor expressed on myeloid cells.
Figure 2
Figure 2
TREM-2 expression in non-parenchymal liver cells and activated HSCs during liver injury. (A) TREM-2 expression in primary mouse hepatocytes, KCs or qHSCs detected by flow cytometry. Red and blue lines depict the isotype and TREM-2 antibodies respectively. (B) qRT-PCR analysis of Trem-2 expression in various liver cell types. n=10 (hepatocytes), 4 (KCs) and 5 (qHSCs). (C) TREM-2 expression in mouse, rat and human HSCs during trans-differentiation in vitro at day 1 (quiescent) and day 7 (activated) after the isolation. n=3. (D) Transcript levels of Acta2 and Col1a1 in WT and Trem-2-/- activated mouse HSCs. n=3. (E) Trem-2 expression in rat HSCs activated in vivo from CCl4 and BDL treated rats. n=4–5 per condition. Data represent mean±SEM and *, **, *** denote a P value of ˂0.05, ˂0.01 and ˂0.001, respectively versus quiescent (C) or olive oil or sham (E) and statistical analysis used was unpaired Student’s t-test. Data in (C,E) are representative of two and in (D) is representative of three independent experiments BDL, bile duct ligation; CCl4, carbon tetrachloride; HSCs, hepatic stellate cells; KCs, Kupffer cells; qHSC, quiescent HSC; TREM, triggering receptor expressed on myeloid cells; WT, wild type.
Figure 3
Figure 3
TREM-2 impacts chronic CCl4-induced liver injury. (A–E) WT and Trem-2-/- mice were treated with CCl4 for 8 weeks, sacrificed 1 or 5 days after the last CCl4 injection and (A) liver Mcp1, Mmp13 (B) ALT and AST levels were determined. (C) Necrosis, apoptosis and fibrosis histology score from WT and Trem-2-/- mice that were treated with CCl4 for 8 weeks and sacrificed 1 day after the last CCl4 injection. (D) Representative H&E (Magnification is 10x) from day 1 are depicted. (E) Transcript levels of the indicated genes associated with stress and apoptosis were determined. n=3 mice per genotype (olive oil) and 4–8 mice per genotype (CCl4 both time points). Data represent mean±SEM and *, ** denote a P value of ˂0.05 and ˂0.01, respectively versus WT at the same time point (Mann Whitney test). ALT, alanine aminotransferase; AST, aspartate aminotransferase; CCl4, carbon tetrachloride; TREM, triggering receptor expressed on myeloid cells; WT, wild type.
Figure 4
Figure 4
TREM-2 expression within liver resident and infiltrating immune cells is required for dampening of chronic CCl4 induced liver injury. (A–D) WT mice reconstituted with WT-GFP+bone marrow (WT-WT), Trem-2-/- mice reconstituted with Trem-2-/--GFP+bone marrow (Trem-2-/--Trem-2-/-) or chimeric mice (WT-Trem-2-/-) and (Trem-2-/--WT) were treated with CCl4 for 8 weeks and sacrificed 1 day after the last CCl4 injection and (A) serum ALT and AST levels, (B) H&E stain of livers (C) total number of macrophages (defined as CD45+CD11b+Ly6C+Ly6G-F4/80+GFP+ cells, (online supplementary figure 5) normalised to liver weight and (D) liver Mcp1 transcript levels were determined. Data represent mean±SEM and *, **, ***, **** denote a P value of ˂0.05, ˂0.01, ˂0.001 and <0.0001 respectively versus the indicated genotype (one-way analysis of variance, followed by Tukey’s posthoc). n=3 per genotype (olive oil) and 3–5 per genotype (CCl4). ALT, alanine aminotransferase; AST, aspartate aminotransferase; CCl4, carbon tetrachloride; GFP, green fluorescent protein; TREM, triggering receptor expressed on myeloid cells; WT, wild type.
Figure 5
Figure 5
Cytokine responses and mitogen activated protein kinase (MAPK) signalling in WT and Trem-2-/- non-parenchymal hepatic cells after TLR4 stimulation. (A,B) WT and Trem-2-/- KCs were treated with LPS (100 ng/mL) (A) or (B) heat-killed E. coli (2×10⁷ CFU/mL) for the indicated time points (n=4–5 per condition and time point) and levels of Cxcl1, Tnf, Il6 and Il1b were determined by qRT-PCR. (C, D) Cxcl1 (C) and MCP-1 (D) levels in WT and Trem-2-/- activated mouse HSCs treated with 2×10⁷ CFU/mL heat-killed E. coli or 100 ng/mL LPS. n=3 (E. coli) and 4 (LPS). (E) Human HSC LX-2 cells were transfected with a control or TREM-2 overexpressing plasmid (n=4 per condition) and 36 hours post-transfection stimulated with 100 ng/mL LPS for 3 hours and levels of TREM-2, MCP-1 and IL-6 determined by qRT-PCR. (F,G) WT and Trem-2-/- KCs were treated with 100 ng/mL LPS (F) or 2×10⁷ CFU/mL heat-killed E. coli (G) for the indicated time points and phosphorylation of ERK1/2, p38, JNK, p65 and IκB-α degradation was determined by western blotting. Data represent mean±SEM and *, **, ***, **** denote a P value of ˂0.05, ˂0.01, ˂0.001 and <0.0001, respectively versus WT at the same time point (one-way analysis of variance, followed by Tukey’s posthoc test). Data in (C,D) are representative of two independent experiments. Cxcl1, C-X-C motif chemokine ligand 1; ERK, extracellular regulated kinase; HSCs, hepatic stellate cells; JNK, Jun N-terminal kinase; KCs, Kupffer cells; LPS, lipopolysaccharide; MCP-1, monocyte chemoattractant protein-1; TREM, triggering receptor expressed on myeloid cells; WT, wild type.
Figure 6
Figure 6
TREM-2 blunts acute CCl4 induced hepatic inflammation and injury. (A–C) Serum AST/ALT (A), representative H&E stains of liver (B) and qRT-PCR of liver Cxcl1 (C) postacute CCl4 treatment of WT and Trem-2-/- mice for the indicated times. (D) Representative images of liver sections immunostained for neutrophils (anti-neutrophil marker (NIMP)) of WT and Trem-2-/- mice 24 hours after acute CCl4 treatment. Arrows denote positively stained cells. Manual counts for NIMP-positive cells in livers post-CCl4 treatment are depicted. (E) Representative flow cytometry plot of hepatic neutrophils of WT and Trem-2-/- mice 24 hours postacute CCl4 treatment. Total number of neutrophils normalised to liver weight are indicated. All data represent mean±SEM and *, ** denote a P value of ˂0.05 and ˂0.01, respectively versus WT at the same time point. n=5 mice per condition (A–C), three mice per condition (D) and n=6–10 mice per condition and are pooled data from two independent experiments (E). Statistical analysis used was unpaired Student’s t-test. Scale bar in (B) indicates 200 µm. ALT, alanine aminotransferase; AST, aspartate aminotransferase; CCl4, carbon tetrachloride; Cxcl1, C-X-C motif chemokine ligand 1; TREM, triggering receptor expressed on myeloid cells; WT, wild type.
Figure 7
Figure 7
TREM-2 dampens acetaminophen-induced liver injury. (A) WT and Trem-2-/- mice were injected with 300 mg/kg APAP and 24 hours postinjury ALT and AST levels were determined. (B) Representative H&E, F4/80 and Ly-6G stains from the groups of mice are depicted. Trem-2-/- mouse liver exhibit more extensive parenchymal necrosis compared with WT liver. Arrows denote positively stained cells. (C) Manual counts for F4/80 and Ly6G positive cells in livers post-APAP treatment. (D) WT and Trem-2-/- mice were injected with 500 mg/kg APAP, and liver Mcp1 levels were determined. (E) WT and Trem-2-/- hepatocytes were treated with indicated doses of APAP for 24 hours and cellular viability evaluated. (F) WT and Trem-2-/- mice were injected with 750 mg/kg APAP and survival was monitored. Data represent mean±SEM and *, **, ***, **** denote a P value of ˂0.05, ˂0.01, ˂0.001 and <0.0001, respectively versus WT. n=5 mice per genotype (A–D), 6 hepatocytes per genotype (E) or 9 mice per genotype (F). Statistical analysis used was unpaired Student’s t-test (A–E) and Log-rank (Mantel-Cox) test (F). Scale bar in (B) indicates 50 µm (left panel) or 200 µm (right panel). Data in (E) are representative of two independent experiments. ALT, alanine aminotransferase; AST, aspartate aminotransferase; APAP, acetaminophen; TREM, triggering receptor expressed on myeloid cells; WT, wild type.
Figure 8
Figure 8
TREM-2 impacts hepatic lipid peroxidation and macrophage ROS levels. (A,B) Representative hepatic 4-HNE stain from WT and Trem-2-/- mice that were either treated with CCl4 for 8 weeks and sacrificed 1 day after the last CCl4 injection (A) or injected with 300 mg/kg APAP for 24 hours (B). n=3 mice per genotype (olive oil) or 4–8 mice per genotype (CCl4) or 5 mice per genotype (APAP). (C) 4-HNE content was determined by ELISA in livers of mice injected with 300 mg/kg APAP for 24 hours. n=5–7 per genotype. (D) Representative hepatic 4-HNE stain from WT mice reconstituted with WT-GFP+BM (WT-WT), Trem-2-/- mice reconstituted with Trem-2-/--GFP+BM (Trem-2-/--Trem-2-/-) or chimeric mice (WT-Trem-2-/-) and (Trem-2-/--WT) that were treated with CCl4 for 8 weeks and sacrificed 1 day after the last CCl4 injection. n=3 per genotype (olive oil) and 3–5 per genotype (CCl4). Scale bar 5× indicates 50 µm and 20× indicates 200 µm. (E,F) WT and Trem-2-/- KCs (E) or BMDM (F) were treated with 100 ng/mL LPS for 3 hour and total cellular ROS levels were determined using flow cytometry for dihydrorhodamine 123. n=3–4 per genotype and condition and a representative histogram is shown. (G) Oxygen consumption rate of naive and LPS-treated BMDM was evaluated. n=4–5 per condition. Data in (C,G) represent mean ±SEM and * and **** denote a P value of< 0.05 and  <0.0001 versus WT. Data in (E) are representative of 3 and (F,G) of two independent experiments. Scale bar in (A,B) indicates 50 µm. APAP, acetaminophen; BMDM, bone marrow derived macrophages; CCl4, carbon tetrachloride; GFP, green fluorescent protein; 4-HNE, 4-hydroxynonenal; KCs, Kupffer cells; LPS, lipopolysaccharide; ROS, reactive oxygen species; TREM, triggering receptor expressed on myeloid cells; WT, wild type.
Figure 9
Figure 9
PAMPs are upstream of TREM-2 during liver injury (A–C) WT and Trem-2-/- mice that either received antibiotics or not in their drinking water for 4 weeks were injured acutely with CCl4 and 8 hours postinjection were orally gavaged with 4KDa-fluorescein isothiocyanate (FITC) Dextran and sacrificed 4 hours later. Serum levels of FITC Dextran (A), AST/ALT (B) and qRT-PCR of liver Il6 and Il1b (C) were determined. Data represent mean±SEM and *, ** denote a P value of ˂0.05 and ˂0.01, respectively versus the indicated genotype and condition (Student’s t-test). n=8–9 mice per genotype and condition. Abx, antibiotics; ALT, alanine aminotransferase; AST, aspartate aminotransferase; CCl4, carbon tetrachloride; IL, interleukin; PAMPs, pathogen-associated molecular patterns; TREM, triggering receptor expressed on myeloid cells; WT, wild type.

Comment in

References

    1. Thobe BM, Frink M, Hildebrand F, et al. . The role of MAPK in Kupffer cell toll-like receptor (TLR) 2-, TLR4-, and TLR9-mediated signaling following trauma-hemorrhage. J Cell Physiol 2007;210:667–75. 10.1002/jcp.20860 - DOI - PubMed
    1. Paik YH, Schwabe RF, Bataller R, et al. . Toll-like receptor 4 mediates inflammatory signaling by bacterial lipopolysaccharide in human hepatic stellate cells. Hepatology 2003;37:1043–55. 10.1053/jhep.2003.50182 - DOI - PubMed
    1. Liu S, Gallo DJ, Green AM, et al. . Role of toll-like receptors in changes in gene expression and NF-kappa B activation in mouse hepatocytes stimulated with lipopolysaccharide. Infect Immun 2002;70:3433–42. 10.1128/IAI.70.7.3433-3442.2002 - DOI - PMC - PubMed
    1. Seki E, De Minicis S, Osterreicher CH, et al. . TLR4 enhances TGF-beta signaling and hepatic fibrosis. Nat Med 2007;13:1324–32. 10.1038/nm1663 - DOI - PubMed
    1. Shen XD, Ke B, Zhai Y, et al. . Absence of toll-like receptor 4 (TLR4) signaling in the donor organ reduces ischemia and reperfusion injury in a murine liver transplantation model. Liver Transpl 2007;13:1435–43. 10.1002/lt.21251 - DOI - PubMed

Publication types

MeSH terms