. 2018 Sep;53(9):1035-1047.
doi: 10.1007/s00535-018-1437-3. Epub 2018 Jan 27.

Single cell analysis of Crohn's disease patient-derived small intestinal organoids reveals disease activity-dependent modification of stem cell properties

Affiliations

Single cell analysis of Crohn's disease patient-derived small intestinal organoids reveals disease activity-dependent modification of stem cell properties

Kohei Suzuki et al. J Gastroenterol. 2018 Sep.

Abstract

Background: Intestinal stem cells (ISCs) play indispensable roles in the maintenance of homeostasis, and also in the regeneration of the damaged intestinal epithelia. However, whether the inflammatory environment of Crohn's disease (CD) affects properties of resident small intestinal stem cells remain uncertain.

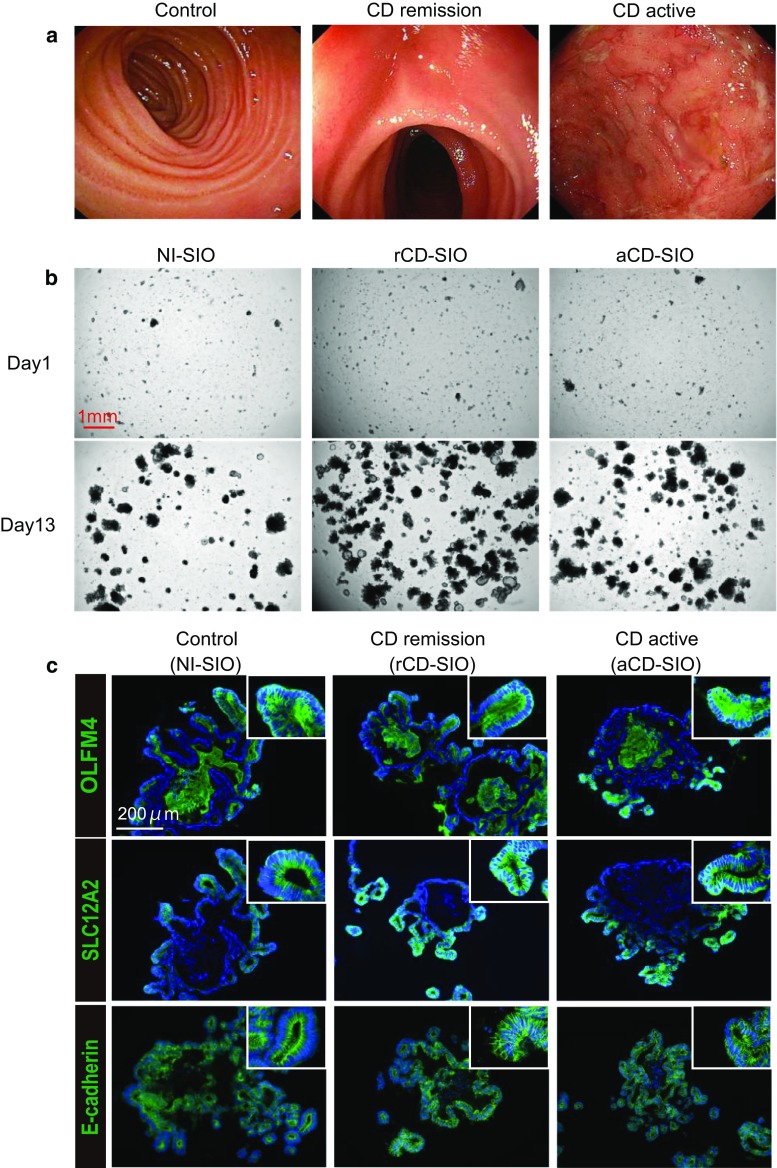
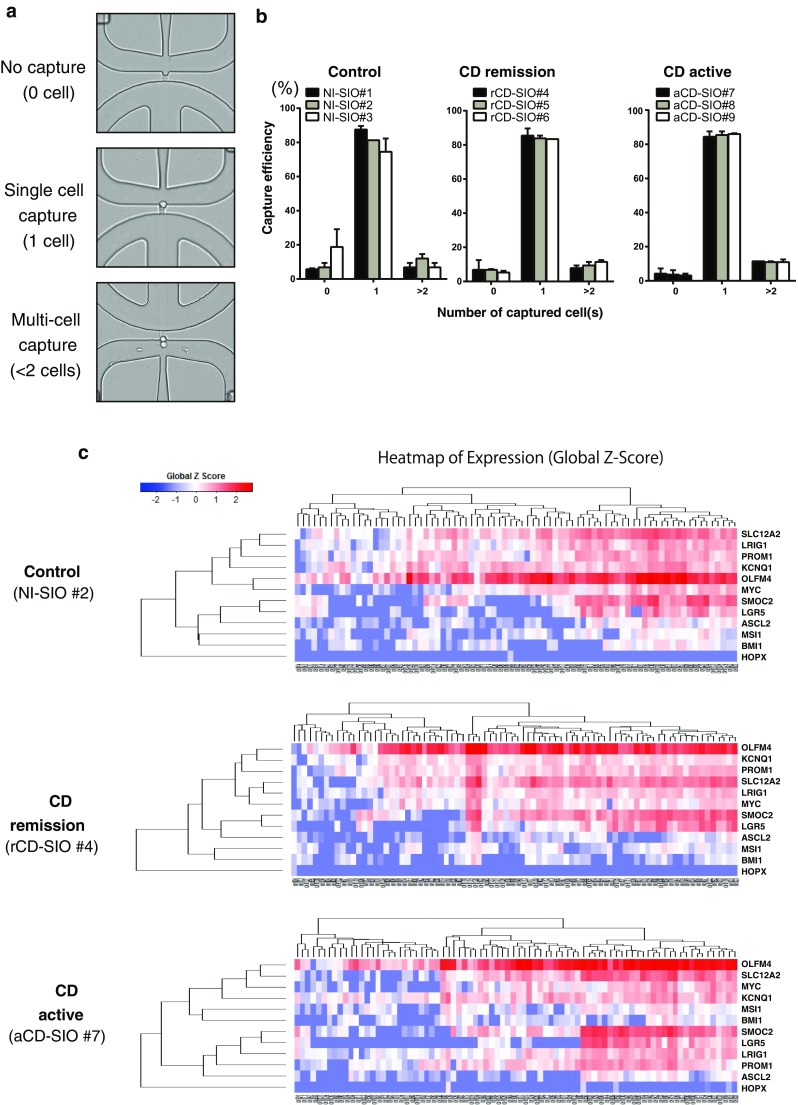
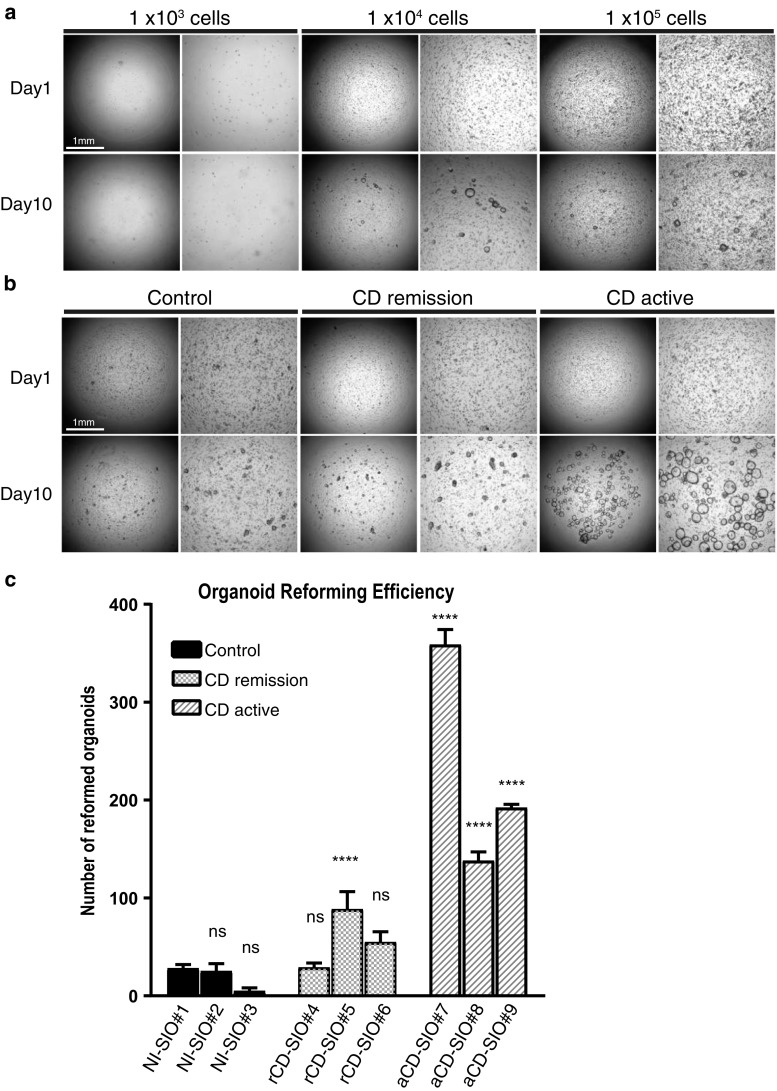
Methods: CD patient-derived small intestinal organoids were established from enteroscopic biopsy specimens taken from active lesions (aCD-SIO), or from mucosa under remission (rCD-SIO). Expression of ISC-marker genes in those organoids was examined by immunohistochemistry, and also by microfluid-based single-cell multiplex gene expression analysis. The ISC-specific function of organoid cells was evaluated using a single-cell organoid reformation assay.

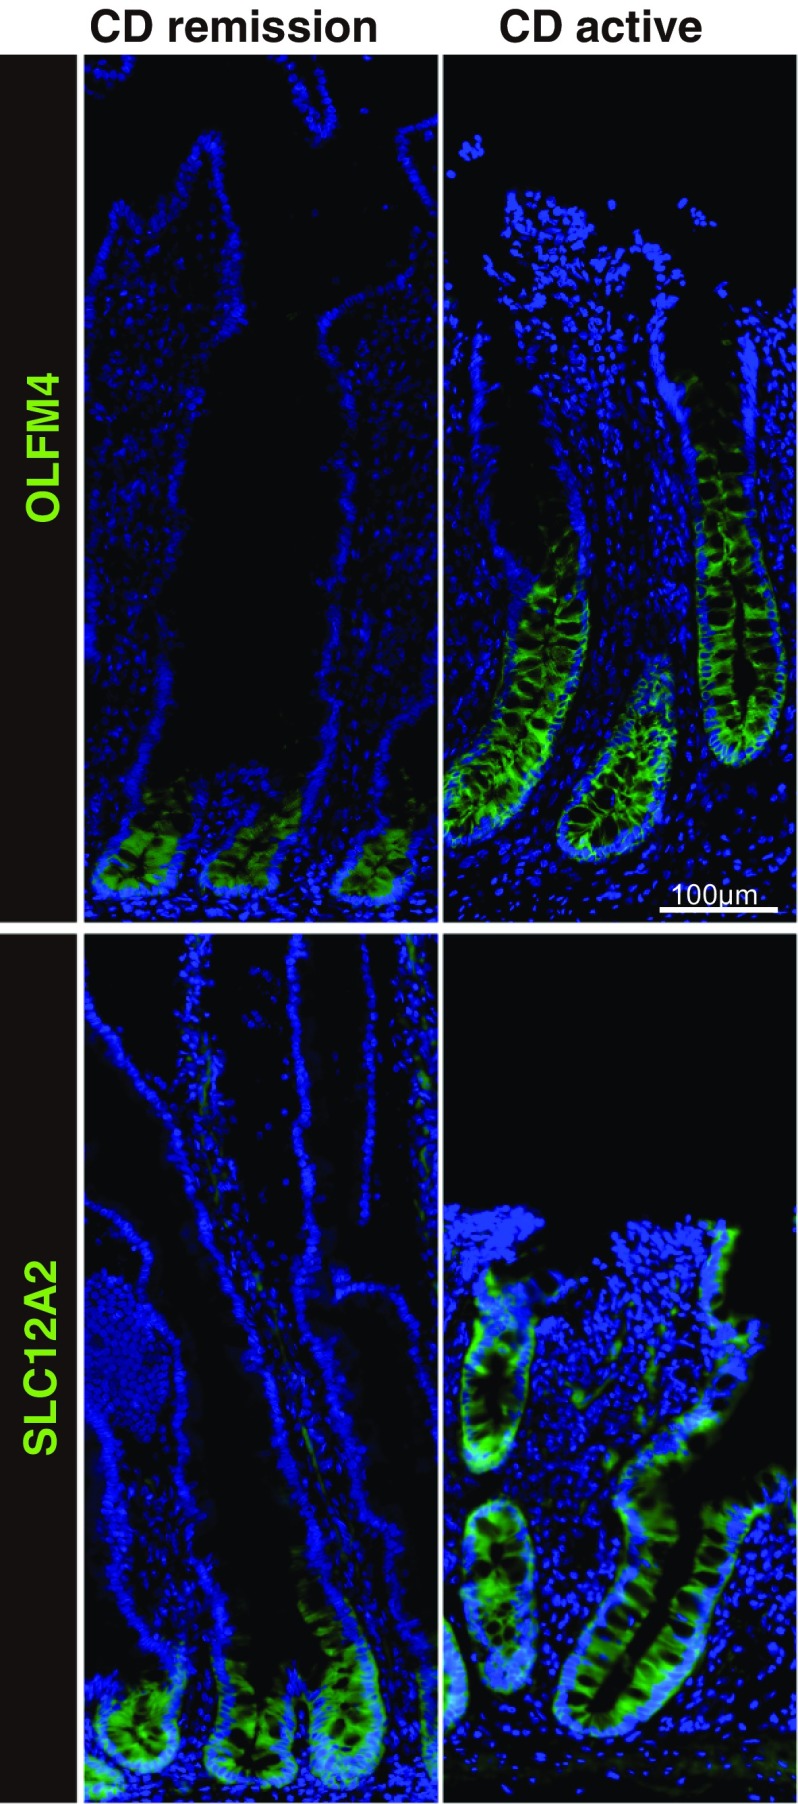
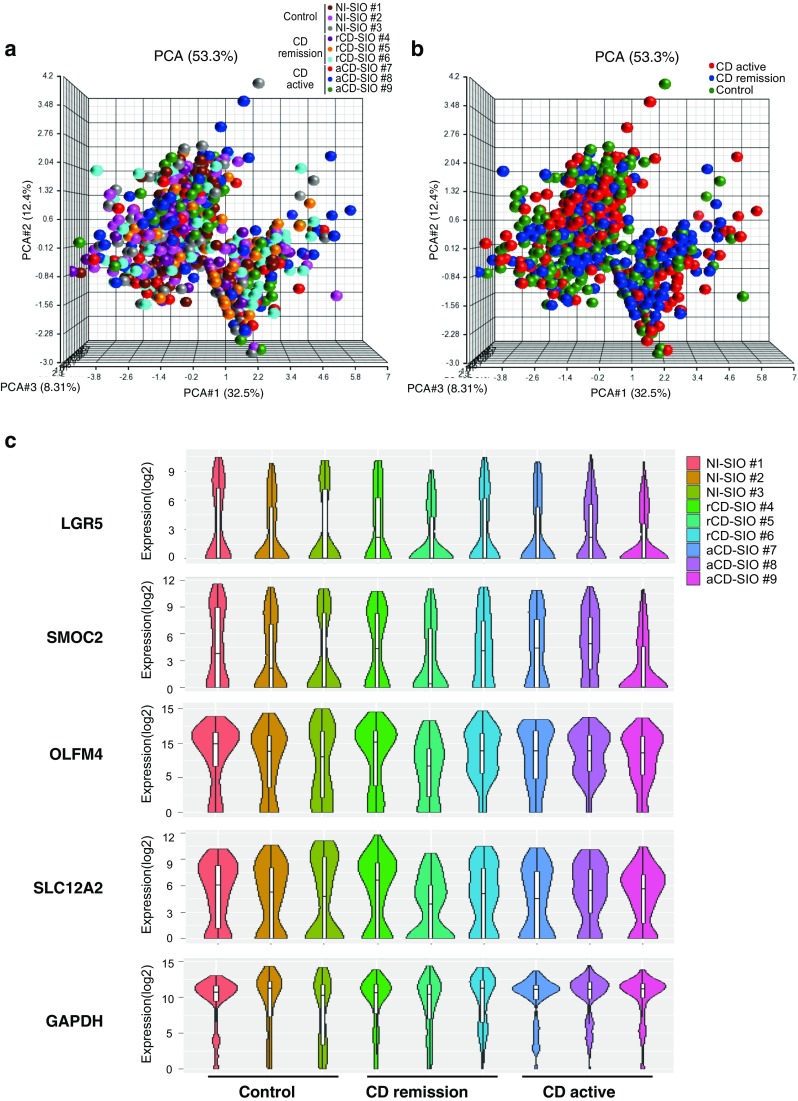
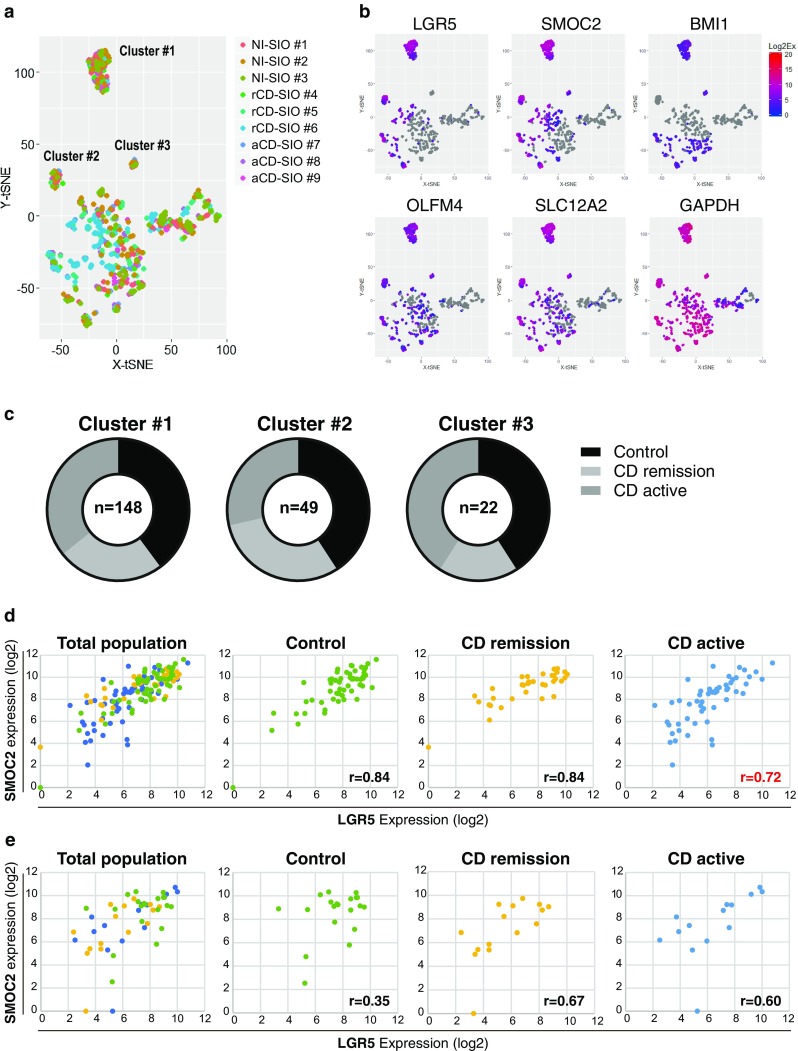
Results: ISC-marker genes, OLFM4 and SLC12A2, were expressed by an increased number of small intestinal epithelial cells in the active lesion of CD. aCD-SIOs, rCD-SIOs or those of non-IBD controls (NI-SIOs) were successfully established from 9 patients. Immunohistochemistry showed a comparable level of OLFM4 and SLC12A2 expression in all organoids. Single-cell gene expression data of 12 ISC-markers were acquired from a total of 1215 cells. t-distributed stochastic neighbor embedding analysis identified clusters of candidate ISCs, and also revealed a distinct expression pattern of SMOC2 and LGR5 in ISC-cluster classified cells derived from aCD-SIOs. Single-cell organoid reformation assays showed significantly higher reformation efficiency by the cells of the aCD-SIOs compared with that of cells from NI-SIOs.

Conclusions: aCD-SIOs harbor ISCs with modified marker expression profiles, and also with high organoid reformation ability. Results suggest modification of small intestinal stem cell properties by unidentified factors in the inflammatory environment of CD.

Keywords: Crohn’s disease; Intestinal organoids; Intestinal stem cell; Single cell analysis.


Conflict of interest statement

The authors declare that they have no conflict of interest.

Figures

Fig. 1
Fig. 1
Immunostaining of small intestinal tissues for stem cell-specific genes, OLFM4 and SLC12A2. Small intestinal surgical specimens obtained from CD patients were subjected to immunostaining of OLFM4 and SLC12A2 (green). Results of small intestinal tissues obtained from active lesions of a CD patient (CD active) and those from CD patients in remission (CD remission) are shown. The same regions of the ileum were analyzed
Fig. 2
Fig. 2
Establishment of small intestinal organoids from CD patients. a Enteroscopic view of the representative mucosa subjected to biopsy sampling: Control, patient #1; CD remission, patient #5; CD active, patient #7. b The efficient growth of small intestinal organoids in standard culture medium (WENR medium) can be seen. Data show representative phase-contrast views of patient-derived small intestinal organoids at passage 3: Control, patient #1 (non-IBD control, NI-SIO #1); CD remission, patient #4 (CD remission, rCD-SIO #4); CD active, patient #7 (CD active, aCD-SIO#7). c Immunostaining of SIOs at passage 3: Control, patient #2 (NI-SIO #2); CD remission, patient #4 (rCD-SIO #4); CD active, patient #7 (aCD-SIO #7). Immunostaining for OLFM4, SLC12A2 or E-cadherin (green) is shown. Positive signals in the organoid lumens may represent secreted forms OLFM4
Fig. 3
Fig. 3
Establishment of single-cell analysis using patient-derived small intestinal organoids. a A representative picture showing successful and unsuccessful cases of a single-cell capture. b Efficiency of single-cell capture using patient-derived small intestinal organoids. Data are expressed as mean ± SEM of 2 rounds of capture. c Hierarchical analysis of single-cell data based on the expression profile of 12 intestinal stem cell (ISC)-specific genes. Single-cell gene expression data were acquired from small intestinal organoids established from non-IBD control (non-IBD control, NI-SIO #2), CD patient in remission (CD remission, rCD-SIO #4) or from an active lesion of a CD patient (CD active, aCD-SIO #7). 135 cells were subjected to the analysis for each small intestinal organoid. Gene expression profiles of individual cells after elimination of outlier cells are shown
Fig. 4
Fig. 4
Limited variance of ISC-marker gene expression profile among cells constituting patient-derived small intestinal organoids. a Comprehensive principal component analysis (PCA) of the total single-cell gene expression data acquired from small intestinal organoids. Data shows distributions of gene expression variance at the single-cell level, after elimination of outlier cells (n = 1037). Color key indicates each patient-derived small intestinal organoid. b The same analysis shown in (a) displaying single-cell level gene expression variance of each small intestinal organoid group. c Violin plot showing single-cell gene expression level (Y-axis), and cell frequency (X-axis) in small intestinal organoids
Fig. 5
Fig. 5
Identification of distinct cell clusters in small intestinal organoids based on single-cell level ISC-marker gene expression profile. a Data showing t-SNE analysis of the total single-cell gene expression data. Analysis was performed by the following conditions: perplexity = 17; iteration = 5000. Color key indicates each patient-derived small intestinal organoid. Note that cluster of cells is identified at the upper left region (Cluster #1), mid left region (Cluster #2) and also at the center region (Cluster #3). b Expression level of ISC-marker genes in individual cells. Redness intensity indicates the expression level of each gene. Gray color indicates negative expression. c Relative proportions of cells located in Cluster #1, Cluster #2 and Cluster #3. d Expression level of SMOC2 and LGR5 in individual cells located in Cluster #1. e Expression level of SMOC2 and LGR5 in individual cells located in Cluster #2
Fig. 6
Fig. 6
Active CD-small intestinal organoids harbor increased number of ISCs retaining organoid reformation ability. a Optimization of single-cell based organoid reformation assay. NI-SIO #2 was dissociated into single cells, and seeded onto a 96-well plate at the designated cell density. Data shows phase contrast view at the beginning of the culture and after 10 days of culture in WENR medium. b Single-cell based organoid reformation assay using patient-derived small intestinal organoids. Organoids were dissociated into single cells, and seeded onto 96-well plate at a density of 1 × 104 cells per well. Data shows phase contrast view at the beginning of the culture and after 10 days of culture in WENR medium. c Quantification of organoid reformation efficiency for each small intestinal organoid. Data are shown as mean ± SEM of triplicate analysis. ****Indicates P < 0.0001 determined by two-way ANOVA, compared to NI-SIO#1

References

    1. Crosnier C, Stamataki D, Lewis J. Organizing cell renewal in the intestine: stem cells, signals and combinatorial control. Nat Rev Genet. 2006;7:349–359. doi: 10.1038/nrg1840. - DOI - PubMed
    1. Okamoto R, Watanabe M. Role of epithelial cells in the pathogenesis and treatment of inflammatory bowel disease. J Gastroenterol. 2016;51:11–21. doi: 10.1007/s00535-015-1098-4. - DOI - PubMed
    1. Clevers H. The intestinal crypt, a prototype stem cell compartment. Cell. 2013;154:274–284. doi: 10.1016/j.cell.2013.07.004. - DOI - PubMed
    1. Muñoz JMN, Stange DE, Schepers AG, et al. The Lgr5 intestinal stem cell signature: robust expression of proposed quiescent “+4” cell markers. EMBO J. 2012;31:3079–3091. doi: 10.1038/emboj.2012.166. - DOI - PMC - PubMed
    1. Foulke-Abel J, In J, Yin J, et al. Human enteroids as a model of upper small intestinal ion transport physiology and pathophysiology. Gastroenterology. 2016;150:638–649. doi: 10.1053/j.gastro.2015.11.047. - DOI - PMC - PubMed

MeSH terms