. 2018 Jan 10:11:112.
doi: 10.3389/fncir.2017.00112. eCollection 2017.

Fear Learning Regulates Cortical Sensory Representations by Suppressing Habituation

Affiliations

Fear Learning Regulates Cortical Sensory Representations by Suppressing Habituation

Shea N Gillet et al. Front Neural Circuits. .

Abstract

Projections from auditory cortex to the amygdala are thought to contribute to the induction of auditory fear learning. In addition, fear conditioning has been found to enhance cortical responses to conditioned tones, suggesting that cortical plasticity contributes to fear learning. However, the functional role of auditory cortex in the retrieval of fear memories is unclear and how fear learning regulates cortical sensory representations is not well understood. To address these questions, we use acute optogenetic silencing and chronic two-photon calcium imaging in mouse auditory cortex during fear learning. Longitudinal imaging of neuronal ensemble activity reveals that discriminative fear learning modulates cortical sensory representations via the suppression of cortical habituation.

Keywords: GCaMP; auditory cortex; cortical circuits; fear conditioning; interneurons; learning and memory; somatostatin.


Figures

FIGURE 1
FIGURE 1
Auditory cortex is required for discriminative fear learning. (A) (Left) Schematic of auditory fear conditioning protocol. ITI, inter-trial interval; US, unconditioned stimulus. (Right) After conditioning, there is a selective reduction in licking during the CS+. Raster plot shows individual licks during CS– (blue) and CS+ (red) trials for one mouse on the day before (Pre) and after (Post) conditioning. (B) Summary data (n = 32 mice) showing selective reduction in lick rate (normalized to ITI rate) during CS+ tones on the post conditioning day (paired t-test, p < 0.001). (C) Cortical inactivation blocks expression of discriminative fear learning. (Left) Schematic for cortical silencing during memory retrieval in VGAT-ChR2 mice. Blue tics, LED flashes. (Right) Trial by trial analysis of lick rates (normalized to ITI lick rate) for control (LED off) and cortical inactivation (LED on) trials (n = 9 mice). Mice respond differently to CS+ and CS– tones on control trials (paired t-test, p = 0.035, 1st LED Off trial; p = 0.008, 2nd LED Off trial), but not on inactivation trials (p = 0.349, 1st LED On trial; p = 0.544, 2nd LED On trial). (D) Cortical inactivation has no effect on memory retrieval during simple (non-discriminative) fear learning using only one tone. (Left) Simple fear conditioning protocol. (Right) Summary data of lick rates to CS tones before (Pre) and after (Post) conditioning. Lick rates are reduced similarly whether the LED is off or on during interleaved CS trials (n = 5 mice, paired t-test, p = 0.637). Error bars are SEM. P < 0.05, ∗∗P < 0.01, ∗∗∗P < 0.001, ns, not significant.
FIGURE 2
FIGURE 2
Imaging A1 sensory representations in awake mice. (A) (Top) Recording schematic. (Bottom) In vivo image of GCaMP6s in layer 2/3 pyramidal cells (green) and tdTomato-expressing interneurons (red). (B) (Top) Example traces of GCaMP6s responses in two pyramidal cells showing tone-evoked excitation (left) and inhibition (right). (Bottom, left) Spatial map of cells in one imaging field with significant excitatory responses to either the CS– (blue), CS+ (red), or both tones (purple). Non-responsive cells (NR) marked as white. (Right) Same as left panel, but for cells with significant inhibitory responses.
FIGURE 3
FIGURE 3
Responses of individual L2/3 pyramidal cells before and after fear conditioning. (A–D) Averaged dF/F responses to CS+ (red) and CS– (blue) tones before (Pre) and after (Post) conditioning are shown for four individual cells from two mice. Top, images of the same cells on Day 1 (Pre) and Day 4 (Post) of the identical fear conditioning protocol used for behavioral analysis. Traces show responses to the tones indicated by gray bars.
FIGURE 4
FIGURE 4
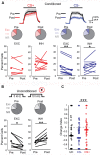
Fear conditioning prevents habituation of cortical sensory representations. (A) Left, responses to CS+ tones are similar before and after fear conditioning. Top, average CS+ tone response (n = 66 cells, 10 mice) before (Pre) and after (Post) conditioning. Line, average; shading, SEM. Middle, pie charts show fraction of cells with significant excitation (Exc), inhibition (Inh), or no response (NR) before (13, 20, and 67%, respectively) and after (12, 21, and 67%) conditioning. Bottom, fear conditioning does not change fraction of cells excited (EXC) or inhibited (INH) in individual mice (Paired t-test, excitation: p = 0.550, n = 7 mice; inhibition: p = 0.718, n = 10 mice). Lines, individual mice; filled circles, average. (Right) Excitation to CS– tones is significantly reduced after conditioning. Top, average CS– response of all cells (n = 88 cells, 10 mice). Middle, fraction of Exc, Inh, and NR CS– cells before (16, 14, and 70%, respectively) and after (10, 20, and 71%) conditioning. Bottom, fraction of cells excited by CS– tones decreases while fraction that are inhibited increases (Paired t-test, excitation: p = 0.001; inhibition: p = 0.014). (B) In a cohort of unconditioned mice (n = 9) that experienced the same protocol without shock, tone-evoked excitation decreases and inhibition is enhanced. Pie charts show fraction of cells with significant excitation (Exc), inhibition (Inh), or no response (NR) on Day 1 (13, 12, and 75%, respectively) and Day 4 (7, 19, and 74%). Bottom, fraction of cells excited or inhibited in individual mice (Paired t-test, excitation: p = 0.035; inhibition: p = 0.006). (C) Change index reveals a reduction in the magnitude of excitatory responses to CS– (n = 88 cells) but not CS+ tones (n = 66 cells, n = 10 mice, two-sample t-test, p < 0.001) following fear conditioning. Unconditioned mice experiencing the same tones show a reduction in response strength (n = 9 mice, 77 cells, two-tailed t-test, p < 0.001) virtually identical to CS– responses in conditioned animals (two-sample t-test, p = 0.385). Bars, average. P < 0.05, ∗∗P < 0.01, ∗∗∗P < 0.001.
FIGURE 5
FIGURE 5
Fear conditioning modulates CS+ and CS– sensory representations. (A) Fraction of discriminating cells decreases in unconditioned (paired t-test, p = 0.016) but not in conditioned mice (two-sample t-test, p = 0.47). (B) Euclidean distance between tone population vectors is reduced in unconditioned animals (paired t-test, p = 0.048) but is maintained in conditioned animals (paired t-test, p = 0.176). p < 0.05, ∗∗p < 0.01, ∗∗∗p < 0.001. (C) Change index showing the strength of excitatory responses during the first (left) or last (right) 2 s of tone presentation for conditioned (CS+ and CS–) and unconditioned (UC) mice. Although overall CS+ and CS– responses are reduced similarly at the beginning of the tone, CS+ responses are significantly stronger than CS– responses during the last 2 s of the tones (paired t-test, p = 0.017, n = 10 mice).
FIGURE 6
FIGURE 6
Discriminative fear conditioning selectively enhances SOM cell responses to CS– tones. (A) Top, GCaMP6s targeting approach in PV-cre mice. Bottom, in vivo image of GCaMP6s-expressing PV cells. (B) A decrease in PV cell tone-evoked excitation to both CS+ and CS– tones after fear conditioning. Top, fraction of PV cells with excitatory (EXC), inhibitory (INH) or no response (NR) to CS+ and CS– tones before (Pre) and after (Post) conditioning. CS+ Pre (18, 25, and 57%, respectively) and CS+ Post (2, 31, and 67%); CS– Pre (8, 18, and 74%) and CS– Post (<1, 33, and 67%). Bottom, fraction of cells shown separately for individual mice in response to CS+ (paired t-test, excitation: p = 0.088, n = 4 mice; inhibition: p = 0.300, n = 6) and CS– (paired t-test, excitation: p = 0.021, n = 6; inhibition: p = 0.029, n = 5). (C) Change index reveals a reduction in PV cell response strength to CS+ (n = 6 mice, 38 cells) and CS– (n = 6 mice, n = 24 cells; two-sample t-test, p = 0.927). Bars, average. (D) Top, GCaMP6s targeting in SOM-cre mice. Bottom, in vivo image of SOM cells. (E) SOM cell responses to CS+ tones are unchanged while excitation to CS– tones is enhanced following conditioning. Top, fraction of SOM cells with excitatory (EXC), inhibitory (INH) or no response (NR) to CS+ and CS– tones before (Pre) and after (Post) conditioning. CS+ Pre (51, 16, and 34%) and CS+ Post (64, 13, and 23%); CS– Pre (47, 16, and 37%) and CS– Post (69, 14, and 17%). Bottom, fraction of cells shown separately for individual mice in response to CS+ (paired t-test, excitation: p = 0.145; inhibition: p = 0.331, n = 7 mice) and CS– (paired t-test, excitation: p = 0.004; inhibition: p = 0.531). (F) Change index reveals an increase in SOM cell response strength to CS– but not CS+ tones (n = 7 mice, 78 cells; two-sample t-test, p < 0.001). p < 0.05, ∗∗p < 0.01, ∗∗∗p < 0.001.

References

    1. Aizenberg M., Geffen M. N. (2013). Bidirectional effects of aversive learning on perceptual acuity are mediated by the sensory cortex. Nat. Neurosci. 16 994–996. 10.1038/nn.3443 - DOI - PubMed
    1. Banerjee S. B., Gutzeit V. A., Baman J., Aoued H. S., Doshi N. K., Liu R. C., et al. (2017). Perineuronal nets in the adult sensory cortex are necessary for fear learning. Neuron 95 169.e3–179.e3. 10.1016/j.neuron.2017.06.007 - DOI - PMC - PubMed
    1. Boatman J. A., Kim J. J. (2006). A thalamo-cortico-amygdala pathway mediates auditory fear conditioning in the intact brain. Eur. J. Neurosci. 24 894–900. 10.1111/j.1460-9568.2006.04965.x - DOI - PubMed
    1. Chen T.-W., Wardill T. J., Sun Y., Pulver S. R., Renninger S. L., Baohan A., et al. (2013). Ultrasensitive fluorescent proteins for imaging neuronal activity. Nature 499 295–300. 10.1038/nature12354 - DOI - PMC - PubMed
    1. Grosso A., Cambiaghi M., Concina G., Sacco T., Sacchetti B. (2015). Auditory cortex involvement in emotional learning and memory. Neuroscience 299 45–55. 10.1016/j.neuroscience.2015.04.068 - DOI - PubMed

Publication types

MeSH terms