

Neuronal Assemblies Evidence Distributed Interactions within a Tactile Discrimination Task in Rats
- PMID: 29375324
- PMCID: PMC5768614
- DOI: 10.3389/fncir.2017.00114
Neuronal Assemblies Evidence Distributed Interactions within a Tactile Discrimination Task in Rats
Abstract
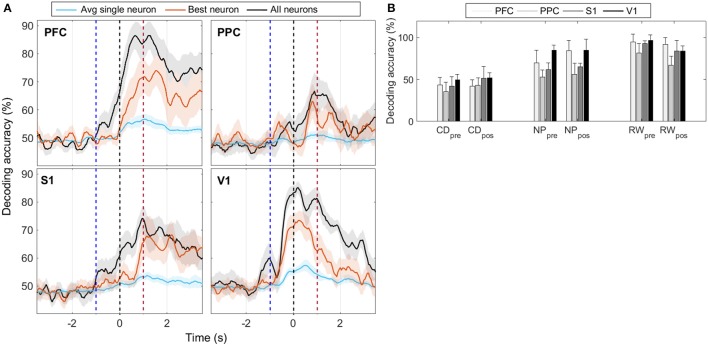
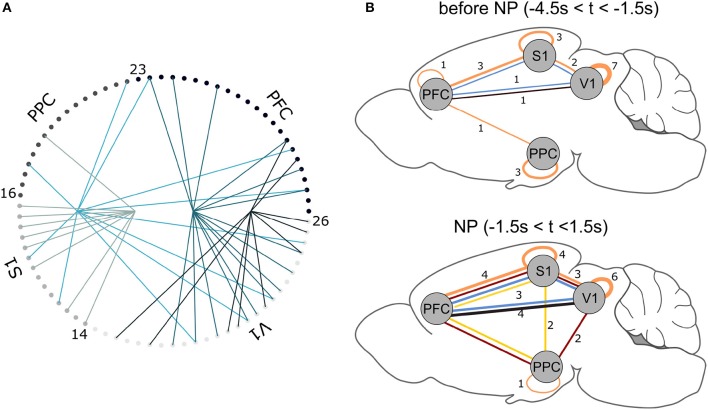
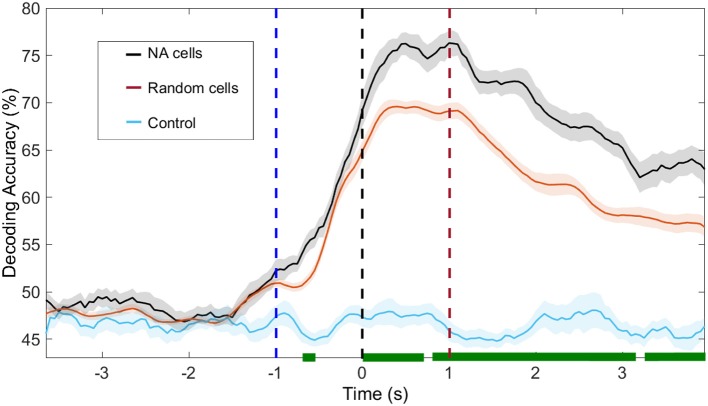
Accumulating evidence suggests that neural interactions are distributed and relate to animal behavior, but many open questions remain. The neural assembly hypothesis, formulated by Hebb, states that synchronously active single neurons may transiently organize into functional neural circuits-neuronal assemblies (NAs)-and that would constitute the fundamental unit of information processing in the brain. However, the formation, vanishing, and temporal evolution of NAs are not fully understood. In particular, characterizing NAs in multiple brain regions over the course of behavioral tasks is relevant to assess the highly distributed nature of brain processing. In the context of NA characterization, active tactile discrimination tasks with rats are elucidative because they engage several cortical areas in the processing of information that are otherwise masked in passive or anesthetized scenarios. In this work, we investigate the dynamic formation of NAs within and among four different cortical regions in long-range fronto-parieto-occipital networks (primary somatosensory, primary visual, prefrontal, and posterior parietal cortices), simultaneously recorded from seven rats engaged in an active tactile discrimination task. Our results first confirm that task-related neuronal firing rate dynamics in all four regions is significantly modulated. Notably, a support vector machine decoder reveals that neural populations contain more information about the tactile stimulus than the majority of single neurons alone. Then, over the course of the task, we identify the emergence and vanishing of NAs whose participating neurons are shown to contain more information about animal behavior than randomly chosen neurons. Taken together, our results further support the role of multiple and distributed neurons as the functional unit of information processing in the brain (NA hypothesis) and their link to active animal behavior.
Keywords: distributed cortical interactions; independent component analysis; neuronal assemblies; rat; tactile discrimination.
Figures
Similar articles
-
Simultaneous top-down modulation of the primary somatosensory cortex and thalamic nuclei during active tactile discrimination.J Neurosci. 2013 Feb 27;33(9):4076-93. doi: 10.1523/JNEUROSCI.1659-12.2013. J Neurosci. 2013. PMID: 23447616 Free PMC article.
-
Oscillatory cortico-cortical connectivity during tactile discrimination between dynamic and static stimulation.Cereb Cortex. 2024 Sep 3;34(9):bhae277. doi: 10.1093/cercor/bhae277. Cereb Cortex. 2024. PMID: 39331031
-
Theta Phase Entrainment of Single-Cell Spiking in Rat Somatosensory Barrel Cortex and Secondary Visual Cortex Is Enhanced during Multisensory Discrimination Behavior.eNeuro. 2024 Apr 26;11(4):ENEURO.0180-23.2024. doi: 10.1523/ENEURO.0180-23.2024. Print 2024 Apr. eNeuro. 2024. PMID: 38621992 Free PMC article.
-
Multielectrode Recordings in the Somatosensory System.In: Nicolelis MAL, editor. Methods for Neural Ensemble Recordings. 2nd edition. Boca Raton (FL): CRC Press/Taylor & Francis; 2008. Chapter 6. In: Nicolelis MAL, editor. Methods for Neural Ensemble Recordings. 2nd edition. Boca Raton (FL): CRC Press/Taylor & Francis; 2008. Chapter 6. PMID: 21204443 Free Books & Documents. Review.
-
Analysis of haptic information in the cerebral cortex.J Neurophysiol. 2016 Oct 1;116(4):1795-1806. doi: 10.1152/jn.00546.2015. Epub 2016 Jul 20. J Neurophysiol. 2016. PMID: 27440247 Free PMC article. Review.
Cited by
-
Can Neuroscientists Test a New Physicalist Mind/Body View: DiCoToP (Diachronic Conjunctive Token Physicalism)?Front Hum Neurosci. 2021 Dec 17;15:786133. doi: 10.3389/fnhum.2021.786133. eCollection 2021. Front Hum Neurosci. 2021. PMID: 34975437 Free PMC article.
-
Frequency-specific coupling in fronto-parieto-occipital cortical circuits underlie active tactile discrimination.Sci Rep. 2019 Mar 25;9(1):5105. doi: 10.1038/s41598-019-41516-3. Sci Rep. 2019. PMID: 30911025 Free PMC article.
-
Aberrant cortical activity, functional connectivity, and neural assembly architecture after photothrombotic stroke in mice.Elife. 2024 Apr 30;12:RP90080. doi: 10.7554/eLife.90080. Elife. 2024. PMID: 38687189 Free PMC article.
-
Out of the single-neuron straitjacket: Neurons within assemblies change selectivity and their reconfiguration underlies dynamic coding.J Physiol. 2025 Jul;603(14):4063-4090. doi: 10.1113/JP288015. Epub 2025 Jul 10. J Physiol. 2025. PMID: 40638616 Free PMC article.
-
Connecting the dots in the zona incerta: A study of neural assemblies and motifs of inter-area coordination in mice.iScience. 2023 Dec 16;27(1):108761. doi: 10.1016/j.isci.2023.108761. eCollection 2024 Jan 19. iScience. 2023. PMID: 38274403 Free PMC article.
References
Publication types
MeSH terms
LinkOut - more resources
Full Text Sources
Other Literature Sources