. 2018 Jan 12:8:2699.
doi: 10.3389/fmicb.2017.02699. eCollection 2017.

Preliminary Comparison of Oral and Intestinal Human Microbiota in Patients with Colorectal Cancer: A Pilot Study

Affiliations

Preliminary Comparison of Oral and Intestinal Human Microbiota in Patients with Colorectal Cancer: A Pilot Study

Edda Russo et al. Front Microbiol. .

Abstract

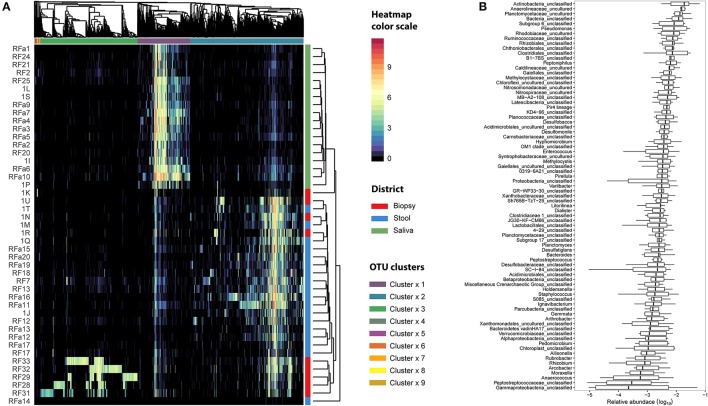
In this study Next-Generation Sequencing (NGS) was used to analyze and compare human microbiota from three different compartments, i.e., saliva, feces, and cancer tissue (CT), of a selected cohort of 10 Italian patients with colorectal cancer (CRC) vs. 10 healthy controls (saliva and feces). Furthermore, the Fusobacterium nucleatum abundance in the same body site was investigated through real-time quantitative polymerase chain reaction (qPCR) to assess the association with CRC. Differences in bacterial composition, F. nucleatum abundance in healthy controls vs. CRC patients, and the association of F. nucleatum with clinical parameters were observed. Taxonomic analysis based on 16S rRNA gene, revealed the presence of three main bacterial phyla, which includes about 80% of reads: Firmicutes (39.18%), Bacteroidetes (30.36%), and Proteobacteria (10.65%). The results highlighted the presence of different bacterial compositions; in particular, the fecal samples of CRC patients seemed to be enriched with Bacteroidetes, whereas in the fecal samples of healthy controls Firmicutes were one of the major phyla detected though these differences were not statistically significant. The CT samples showed the highest alpha diversity values. These results emphasize a different taxonomic composition of feces from CRC compared to healthy controls. Despite the low number of samples included in the study, these results suggest the importance of microbiota in the CRC progression and could pave the way to the development of therapeutic interventions and novel microbial-related diagnostic tools in CRC patients.

Keywords: Fusobacterium nucleatum; colorectal cancer; gut microbiota; oral microbiota; quantitative polymerase chain reaction; taxonomic analysis.


Figures

Figure 1
Figure 1
Taxonomic composition of CRC patient (and healthy controls) microbiota. Relative abundances bar plot showing the relative abundance of bacterial phyla in each sample. All phyla representing less than 5% of the total reads analyzed were included in the “Other” group.
Figure 2
Figure 2
Species accumulation curves of healthy and CRC patients for each sampling body site. CT samples seem to have the highest alpha diversity whereas the bacterial diversity of CRC patients and controls is similar within each body site.
Figure 3
Figure 3
Biodiversity indices distribution according to sampling site and patient status. Patients with CRC and healthy ones reported similar diversity values for all the indices considered. CRC patients showed higher values of alpha diversity in biopsy samples. Asterisks indicate a significant Kruskal-Wallis test with alpha = 0.05.
Figure 4
Figure 4
Microbiota distribution for each analyzed sample. (A) The number of reads assigned to each OTU was log transformed and reported using the color scale whereas sampling body sites were reported with different colors (red for biopsy samples, blue for stool samples, and green for saliva samples). Dendrograms were produced with average clustering method (UPGMA) based on Bray-Curtis distance. Clusters of OTUs were assessed cutting the dendrogram at 0.95 height. (B) The relative abundance of OTUs belonging to cluster 3 was collapsed at Genus level taking into account only the biopsy samples. Genera with an abundance lower than 1% were removed from the analysis. Relative abundance was computed dividing the number of 16S sequences assigned to each OTU by the total number of sequences obtained for each sample. Boxes denote the interquartile range (IQR) between the 25th and the 75th percentile (first and third quartiles), whereas the inner line represents the median. Whiskers represent the lowest and highest values within 1.5 times IQR from the first and third quartiles Outliers were reported using white circles.
Figure 5
Figure 5
qPCR results for quantification of F. nucleatum respect to the total bacterial community; quantification is expressed as the ratio between the Cq value of F. nucleatum 16S rRNA gene and the Cq value of the total bacterial community 16S rRNA gene amplicons. The higher is the ratio value, the lowest is the quantification of the target amplicon in the sample.
Figure 6
Figure 6
Barplots reporting the average number of sequences assigned to each OTU classified as Fusobacterium. Error bars represent the 95% confidence interval of the distribution.
Figure 7
Figure 7
Linear discriminant analysis of association between sampling sites and microbial taxa. A linear discriminant analysis was performed using Lefse and considering the three body sites sampled in this study, namely: biopsy (red), saliva (green), and stool (blue). (A) Different body sites showed a characteristic taxonomic composition with major clades strongly associated with a particular site. Proteobacteria were mostly associated with biopsy samples whereas Fusobacteria and Bacteroidetes were mainly associated with saliva and stool samples, respectively. (B) Saliva samples reported highest values of Fusobacteria members even if (C) Fusobacterium genus was mainly found in biopsy samples. Each body site has been represented using different colors (A) whereas the relative abundance of Fusobacteria (B) and Fusobacterium clade (C) was reported for each subject. Samples coming from control and CRC patients were reported below (B,C).

Similar articles

Cited by

References

    1. Aagaard K., Petrosino J., Keitel W., Watson M., Katancik J., Garcia N., et al. (2013). The human microbiome project strategy for comprehensive sampling of the human microbiome and why it matters. FASEB J. 7, 1012–1022. 10.1096/fj.12-220806 - DOI - PMC - PubMed
    1. Aas J. A., Paster B. J., Stokes L. N., Olsen I., Dewhirst F. E. (2005). Defining the normal bacterial flora of the oral cavity. J. Clin. Microbiol. 43, 5721–5732. 10.1128/JCM.43.11.5721-5732.2005 - DOI - PMC - PubMed
    1. Abdelrhman K. F. A., Bacci G., Mancusi C., Mengoni A., Serena F., Ugolini A. (2016). A first insight into the gut microbiota of the sea turtle Caretta caretta. Front. Microbiol. 7:1060. 10.3389/fmicb.2016.01060 - DOI - PMC - PubMed
    1. Akin H., Tözün N. (2014). Diet, microbiota, and colorectal cancer. J. Clin. Gastroenterol. 48(Suppl. 1), S67–S69. 10.1097/MCG.0000000000000252 - DOI - PubMed
    1. Allen-Vercoe E., Jobin C. (2014). Fusobacterium and Enterobacteriaceae: important players for CRC? Immunol. Lett. 162, 54–61. 10.1016/j.imlet.2014.05.014 - DOI - PMC - PubMed