. 2018 Jan 9:8:1929.
doi: 10.3389/fimmu.2017.01929. eCollection 2017.

Platycodin D Inhibits Inflammatory Response in LPS-Stimulated Primary Rat Microglia Cells through Activating LXRα-ABCA1 Signaling Pathway

Affiliations

Platycodin D Inhibits Inflammatory Response in LPS-Stimulated Primary Rat Microglia Cells through Activating LXRα-ABCA1 Signaling Pathway

Yunhe Fu et al. Front Immunol. .

Abstract

Platycodin D (PLD), an effective triterpenesaponin extracted from Platycodon grandiflorum, has been known to have anti-inflammatory effect. In the present study, we investigate the anti-inflammatory effects of PLD on LPS-induced inflammation in primary rat microglia cells. The results showed that PLD significantly inhibited LPS-induced ROS, TNF-α, IL-6, and IL-1β production in primary rat microglia cells. PLD also inhibited LPS-induced NF-κB activation. Furthermore, our results showed that PLD prevented LPS-induced TLR4 translocation into lipid rafts via disrupting the formation of lipid rafts by inducing cholesterol efflux. In addition, PLD could activate LXRα-ABCA1 signaling pathway which induces cholesterol efflux from cells. The inhibition of inflammatory cytokines by PLD could be reversed by SiRNA of LXRα. In conclusion, these results indicated that PLD prevented LPS-induced inflammation by activating LXRα-ABCA1 signaling pathway, which disrupted lipid rafts and prevented TLR4 translocation into lipid rafts, thereby inhibiting LPS-induced inflammatory response.

Keywords: LPS; LXRα; NF-κB; TLR4; platycodin D.


Figures

Figure 1
Figure 1
Effects of platycodin D (PLD) on the cell viability of primary rat microglia cells. Cells were cultured with different concentrations of PLD (5, 10, 20 µM) in the absence or presence of 0.5 µg/mL LPS for 24 h. The cell viability was determined by MTT assay. The values presented are the means ± SEM of three independent experiments.
Figure 2
Figure 2
Effects of platycodin D (PLD) on LPS-induced ROS, TNF-α, IL-1β, and IL-6 production. Primary rat microglia cells were treated with PLD (5, 10, 20 µM) for 12 h and stimulated with LPS (0.5 µg/mL) for 24 h. The production of TNF-α, IL-1β, and IL-6 were measured by ELISA. The production of ROS was detected by DCFDA-cellular reactive oxygen species detection assay kit (Abcam, Cambridge, UK) and a colorimetric assay kit specific for H2O2 (Sigma, USA). The data presented are the means ± SD of three independent experiments and differences between mean values were assessed by one-way ANOVA with Tukey’s multiple comparison test. #p < 0.05 vs. control group; *p < 0.05, **p < 0.01 vs. LPS group.
Figure 3
Figure 3
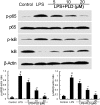
Platycodin D (PLD) inhibits LPS-induced NF-κB activation. Cells were treated with PLD (5, 10, 20 µM) for 12 h and stimulated with LPS (0.5 µg/mL) for 30 min. Protein samples were analyzed by western blotting. The antibodies used for western blotting were purchased from Cell Signaling Technology (Danvers, MA, USA). The values presented are the means ± SD of three independent experiments and differences between mean values were assessed by one-way ANOVA with Tukey’s multiple comparison test (#p < 0.05 vs. control group; *p < 0.05, **p < 0.01 vs. LPS group).
Figure 4
Figure 4
The recruitment of TLR4 to lipid rafts was inhibited by platycodin D (PLD). Cells were pretreated with PLD or MβCD, followed by treatment with LPS. The cells were lysed and subjected to discontinuous sucrose density gradient centrifugation as described in Section “Materials and Methods.” The fractions were analyzed by using CTxB conjugated to horseradish peroxidase (GM1) or anti-TLR4 primary antibody by western blotting. Fractions 3–4 correspond to lipid rafts. Representative blots of three separate experiments are shown. TLR4 content of macrophage lipid rafts was calculated as a percentage of total membrane TLR4 (lipid rafts + nonrafts). The values presented are the means ± SD of three independent experiments and differences between mean values were assessed by one-way ANOVA with Tukey multiple comparison test (#p < 0.05 vs. control group; *p < 0.05, **p < 0.01 vs. LPS group).
Figure 5
Figure 5
Effects of platycodin D (PLD) on lipid rafts cholesterol levels. Cells were treated with PLD (5, 10, 20 µM) for 12 h. Membrane cholesterol levels were measured by gas–liquid chromatography and the results were plotted as µg cholesterol/mg protein. The values presented are the means ± SD of three independent experiments and differences between mean values were assessed by one-way ANOVA with Tukey’s multiple comparison test (#p < 0.05 vs. control group; *p < 0.05, **p < 0.01 vs. LPS group).
Figure 6
Figure 6
Cholesterol replenishment prevents the anti-inflammatory effect of platycodin D (PLD). Cells were treated with culture medium alone or medium containing PLD (5, 10, 20 µM) or MβCD (10 mM) at 37°C for 60 min. Subsequently the cells were washed with PBS and incubated with medium alone or medium containing water-soluble cholesterol (84 µg/ml) for 30 min. Cells were treated with LPS for 24 h. Levels of TNF-α, IL-1β, and IL-6 in culture supernatants were measured by ELISA. Effects of LXRα inhibitor geranylgeranyl pyrophosphate (GGPP) on the anti-inflammatory effects of PLD. Cells were treated with GGPP for 2 h. Then, the cells were treated with PLD for 12 h and stimulated by LPS. The productions of inflammatory cytokines were detected. The values presented are the means ± SD of three independent experiments and differences between mean values were assessed by one-way ANOVA with Tukey’s multiple comparison test (#p < 0.05 vs. control group; *p < 0.05, **p < 0.01 vs. LPS group).
Figure 7
Figure 7
Effects of platycodin D (PLD) on LXR transcriptional activity and LXRα, ABCG1 expression. Cells were transfected with LXRE-driven luciferase reporter vector (LXRE-tk-Luc) and β-galactosidase control vector (Promega). Six hours later, cells were treated with PLD for 12 h. Relative luciferase activity was determined by normalization with β-galactosidase activity (*p < 0.05, **p < 0.01). Effect of PLD on LXRα and ABCG1 expression. Cells were treated with PLD (5, 10, 20 µM) for 12 h. Protein samples were analyzed by western blot with specific antibodies. β-Actin was used as a control. The values presented are the means ± SD of three independent experiments and differences between mean values were assessed by one-way ANOVA with Tukey’s multiple comparison test (*p < 0.05, **p < 0.01).
Figure 8
Figure 8
Knockdown of LXRα abrogated the effects of platycodin D (PLD) on lipid rafts cholesterol levels, and LPS induces inflammatory response in primary rat microglia cells. Cells were transfected with a siRNA specific for LXRα, or a scrambledsiRNA (negative control) as indicated. Then, the cells were treated with PLD (20 µM) for 12 h. The effect of siRNA on LXRα expression was detected by western blotting. Lipid raft cholesterol levels were detected. Meanwhile, the cells were treated with PLD (20 µM) for 12 h and stimulated by LPS for 24 h. Levels of TNF-α, IL-1β, and IL-6 in culture supernatants were measured by ELISA. The data presented are the means ± SD of three independent experiments and differences between mean values were assessed by one-way ANOVA with Tukey’s multiple comparison test (#p < 0.05 vs. control group; *p < 0.05, **p < 0.01 vs. LPS group).

Similar articles

Cited by

References

    1. Hirsch EC, Hunot S. Neuroinflammation in Parkinson’s disease: a target for neuroprotection? Lancet Neurol (2009) 8:382–97.10.1016/S1474-4422(09)70062-6 - DOI - PubMed
    1. Rojo LE, Fernández JA, Maccioni AA, Jimenez JM, Maccioni RB. Neuroinflammation: implications for the pathogenesis and molecular diagnosis of Alzheimer’s disease. Arch Med Res (2008) 39:1–16.10.1016/j.arcmed.2007.10.001 - DOI - PubMed
    1. Thameem Dheen S, Kaur C, Ling EA. Microglial activation and its implications in the brain diseases. Curr Med Chem (2007) 14:1189–97.10.2174/092986707780597961 - DOI - PubMed
    1. Prinz M, Kann O, Draheim HJ, Schumann RR, Kettenmann H, Weber JR, et al. Microglial activation by components of Gram-positive and -negative bacteria: distinct and common routes to the induction of ion channels and cytokines. J Neuropathol Exp Neurol (1999) 58:1078–89.10.1097/00005072-199910000-00006 - DOI - PubMed
    1. Qin L, Li G, Qian X, Liu Y, Wu X, Liu B, et al. Interactive role of the toll-like receptor 4 and reactive oxygen species in LPS-induced microglia activation. Glia (2005) 52:78–84.10.1002/glia.20225 - DOI - PubMed

LinkOut - more resources