Review
. 2017 Sep 29;5(1):1700275.
doi: 10.1002/advs.201700275. eCollection 2018 Jan.

Progress and Perspective of Electrocatalytic CO2 Reduction for Renewable Carbonaceous Fuels and Chemicals

Affiliations
Review

Progress and Perspective of Electrocatalytic CO2 Reduction for Renewable Carbonaceous Fuels and Chemicals

Wenjun Zhang et al. Adv Sci (Weinh). .

Abstract

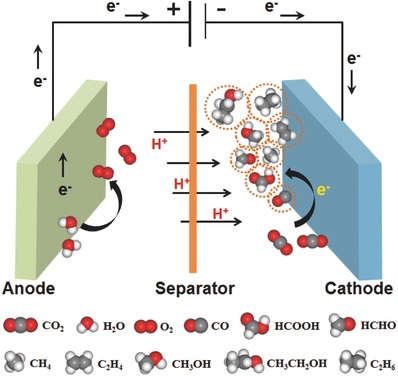
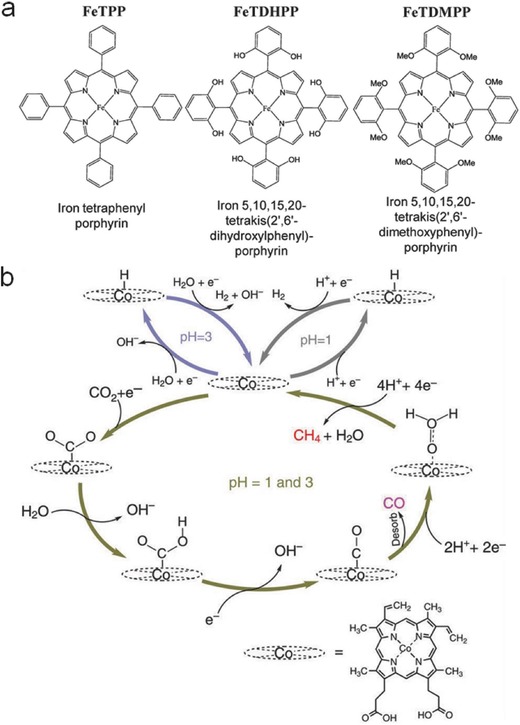
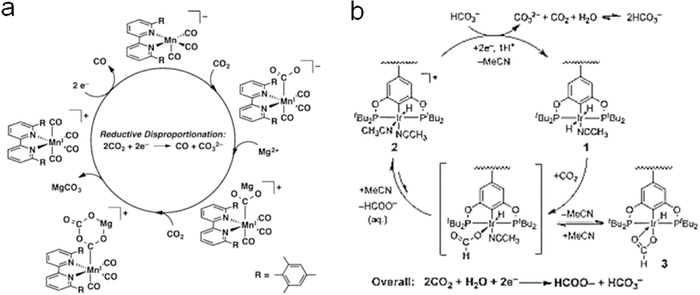
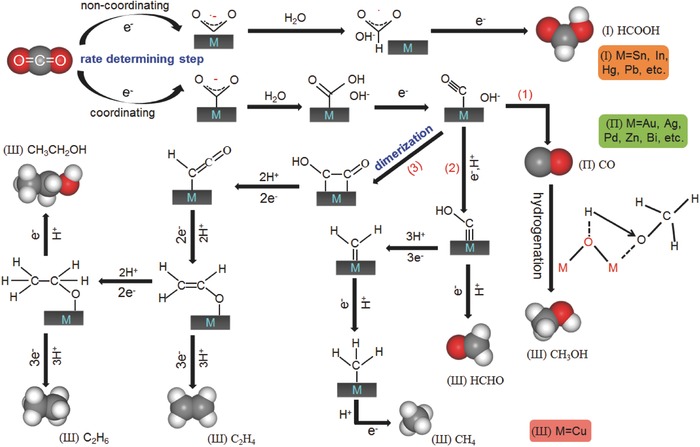
The worldwide unrestrained emission of carbon dioxide (CO2) has caused serious environmental pollution and climate change issues. For the sustainable development of human civilization, it is very desirable to convert CO2 to renewable fuels through clean and economical chemical processes. Recently, electrocatalytic CO2 conversion is regarded as a prospective pathway for the recycling of carbon resource and the generation of sustainable fuels. In this review, recent research advances in electrocatalytic CO2 reduction are summarized from both experimental and theoretical aspects. The referred electrocatalysts are divided into different classes, including metal-organic complexes, metals, metal alloys, inorganic metal compounds and carbon-based metal-free nanomaterials. Moreover, the selective formation processes of different reductive products, such as formic acid/formate (HCOOH/HCOO-), monoxide carbon (CO), formaldehyde (HCHO), methane (CH4), ethylene (C2H4), methanol (CH3OH), ethanol (CH3CH2OH), etc. are introduced in detail, respectively. Owing to the limited energy efficiency, unmanageable selectivity, low stability, and indeterminate mechanisms of electrocatalytic CO2 reduction, there are still many tough challenges need to be addressed. In view of this, the current research trends to overcome these obstacles in CO2 electroreduction field are summarized. We expect that this review will provide new insights into the further technique development and practical applications of CO2 electroreduction.

Keywords: carbon cycle; catalytic mechanisms; electrocatalysts; electrochemical CO2 reduction; renewable fuels.


Figures

Scheme 1
Scheme 1
Illustration of the electrochemical CO2 reduction process and the possible products generated in an electrochemical reaction cell.
Figure 1
Figure 1
Metal–macrocyclic complexes as electrocatalysts for CO2 reduction. a) Investigated iron porphyrins. Reproduced with permission.39 Copyright 2016, American Association for the Advancement of Science. b) Schematic mechanism of the electrochemical CO2 reduction using Co protoporphyrin. Reproduced with permission.40 Copyright 2015, Macmillan Publishers Limited.
Figure 2
Figure 2
a) Redox mechanism of [Mn(mesbpy)(CO)3] and Mg2+ at −1.5 V versus Fc+/0 for electroreduction of CO2 to CO. Reproduced with permission.52 Copyright 2016, American Chemical Society. b) Proposed mechanism for electroreduction of CO2 to HCOO using iridium pincer dihydride electrocatalyst. Reproduced with permission.54
Figure 3
Figure 3
Schematic mechanism of different metal electrocatalysts for CO2 reduction reaction in aqueous solution.
Figure 4
Figure 4
a) Potential‐dependent Faradaic efficiencies of different Au NPs (4, 6, 8, 10 nm) during electrocatalytic reduction of CO2 to CO. b) Current densities (mass activity) for electrocatalytic reduction of CO2 to CO on the Au NPs with different sizes at various applied potentials. Free energy diagrams for electrochemical reduction of c) CO2 to CO and d) protons to hydrogen on Au (111), Au (211), and a 13‐atom Au cluster at −0.11 V (vs RHE), respectively. Reproduced with permission.79 Copyright 2013, American Chemical Society. Free energy diagrams for electrochemical reduction of e) CO2 to CO and f) H+ to H2 on Au(111), Au(211), Au55 NPs, and Au38 NPs at 0 V versus RHE. Reproduced with permission.80 Copyright 2014, American Chemical Society. g) Morphological model of concave rhombic dodecahedron Au NPs with different exposed facets. h) Faradaic efficiencies of different Au NPs and Au film for CO production at applied potential (vs RHE). Reproduced with permission.81 Copyright 2015, American Chemical Society.
Figure 5
Figure 5
a) DFT calculation results on the binding energies of *COOH intermediates as a function of the size of Ag NPs. Reproduced with permission.86 Copyright 2015, American Chemical Society. b) Schematic diagram of nanoporous Ag (scale bar, 500 nm). c) The partial current density of CO production under different overpotentials on polycrystalline silver and nanoporous Ag, respectively. Reproduced with permission.87 Copyright 2014, Macmillan Publishers Limited. d) Free energy diagrams for the electroreduction of CO2 to CO on flat (Ag(100) and Ag(111)) and edge (Ag(221) and Ag(110)) sites. Reproduced with permission.88 Copyright 2015, American Chemical Society.
Figure 6
Figure 6
a) Applied potential dependence of Faradaic efficiencies for CO production over Pd NPs with different sizes. b) Adsorption of *COOH (top) and DFT results on the free energy for CO2 reduction to CO (bottom) on Pd(111), Pd(211), Pd55, and Pd38. Reproduced with permission.94 Copyright 2015, American Chemical Society. c) SEM image of hierarchical hexagonal Zn. d) Free‐energy diagrams of CO2 reduction (left) and HER (right) on Zn (002) and Zn (101). Reproduced with permission.99 (e) Faradaic efficiencies of CO production under different applied potentials on 36 nm freshly reduced Bi/C. f) Faradaic efficiencies and mass activities of CO production on electrodeposited Bi films (Bi‐ED), 36 or 7 nm freshly reduced Bi/C by hydrazine (36 nm Bi/C or 7 nm Bi/C). Reproduced with permission.100 Copyright 2016, American Chemical Society.
Figure 7
Figure 7
Comparison of current densities and Faradaic efficiencies of n‐Cu/C and copper foil. a) Total current density of n‐Cu/C and copper foil. b) Faradaic efficiencies for CH4 generation. c) Methanation current densities. d) Faradaic efficiencies for H2 generation, showing suppressed H2 evolution on n‐Cu/C catalyst. e) Proposed mechanism for the electrochemical reduction of CO2 to CH4, including the rate‐limiting step (RLS), consistent with the electrochemical data and known intermediates identified in the literature. Reproduced with permission.110 Copyright 2014, American Chemical Society.
Figure 8
Figure 8
a) Hydrocarbon selectivity of plasma‐treated Cu foils. Reproduced with permission.114 Copyright 2016, the Author, published under CC‐BY 4.0 license. b) The DFT calculated free energy change of CO2 and CO protonation without glycine (blue lines) and with glycine (red lines). Reproduced with permission.116 Copyright 2016, The Royal Society of Chemistry.
Figure 9
Figure 9
a) Schematic illustration of the species involved in the reaction pathways to generate C2H4 (blue) and C2H5OH (green). Reproduced with permission.118 b) Bar graph reporting the Faradaic efficiencies for each product produced by Cu foil and Cu nanocubes with different sizes at −1.1 V versus RHE. The glassy carbon signal has been subtracted. Reproduced with permission.119
Figure 10
Figure 10
a) Relative turnover rates (TORs) for CO generation and (b–d) proposed mechanism for CO2 reduction on the Au–Cu bimetallic NPs. Reproduced with permission.121 Copyright 2014, Macmillan Publishers Limited. Free energy diagrams for e) H2 evolution and f) CO2 electroreduction to CH4 or CH3OH on W/Au and Cu electrodes. Reproduced with permission.125 Copyright 2014, American Chemical Society.
Figure 11
Figure 11
a) Lateral high‐angle annular dark‐field scanning transmission electron microscopy (HAADF‐STEM) image of partially oxidized Co 4‐atom‐thick layers and (b) the corresponding intensity profile along the pink rectangle in (a). c,d) Corresponding crystal structures. e) Electrochemical active surface area (ECSA) corrected Tafel plots for HCOO production. f) CO2 adsorption isotherms of partially oxidized Co 4‐atom‐thick layers (red), Co 4‐atom‐thick layers (blue), partially oxidized bulk Co (violet) and bulk Co (black). Reproduced with permission.131 Copyright 2016, Macmillan Publishers Limited.
Figure 12
Figure 12
a) Binding configurations of *COOH, *CO, and *CHO on the Mo edge of MoS2. *COOH and *CHO preferably bind to the bridging S atoms, while *CO binds to the Mo atoms. Reproduced with permission.135 b) Cyclic voltammograms (CVs) of rGO–PEI–MoSx modified glassy carbon electrode in N2‐saturated and CO2‐saturated 0.5 m aqueous NaHCO3 solution, respectively. Inset: Structure of PEI. c) Faradaic efficiency for CO (red bars) and H2 (blue bars) production at different applied potentials. Reproduced with permission.136 Copyright 2016, The Royal Society of Chemistry. Free energy diagrams of CO2 conversion to CH4 over d) Cu (211) and e) Mo2C (100) surfaces at 0 V (vs RHE), respectively. The most endergonic step in the overall process is designated with an arrow. Reproduced with permission.141 Copyright 2016, American Chemical Society.
Figure 13
Figure 13
a) TEM image of bamboo‐shaped NCNTs. b) Schematic of CO formation on NCNTs and free‐energy diagram at equilibrium potential for CO2 reduction on pyridinic‐N, pyrrolic‐N, and graphitic‐N defects compared to original CNTs. Reproduced with permission.144 c) The corresponding N functionality content and d) Faradaic efficiency of CO production versus applied potential on N‐doped graphene with different doping temperatures (700–1000 °C). e) Free energy diagrams of electrocatalytic CO2 conversion on N‐doped graphene and f) schematic of nitrogen defects and CO2 reduction mechanism. Reproduced with permission.150 Copyright 2015, American Chemical Society.

References

    1. Shakun J. D., Clark P. U., He F., Marcott S. A., Mix A. C., Liu Z. Y., Otto‐Bliesner B., Schmittner A., Bard E., Nature 2012, 484, 49. - PubMed
    1. Arora V. K., Scinocca J. F., Boer G. J., Christian J. R., Denman K. L., Flato G. M., Kharin V. V., Lee W. G., Merryfield W. J., Geophys. Res. Lett. 2011, 38, 387.
    1. Centi G., Quadrelli E. A., Perathoner S., Energy Environ. Sci. 2013, 6, 1711.
    1. Kondratenko E. V., Mul G., Baltrusaitis J., Larrazábal G. O., Pérez‐Ramírez J., Energy Environ. Sci. 2013, 6, 3112.
    1. Wang W., Wang S. P., Ma X. B., Gong J. L., Chem. Soc. Rev. 2011, 40, 3703. - PubMed