. 2018 Jan 29:7:e31628.
doi: 10.7554/eLife.31628.

The genome of the Hi5 germ cell line from Trichoplusia ni, an agricultural pest and novel model for small RNA biology

Affiliations

The genome of the Hi5 germ cell line from Trichoplusia ni, an agricultural pest and novel model for small RNA biology

Yu Fu et al. Elife. .

Abstract

We report a draft assembly of the genome of Hi5 cells from the lepidopteran insect pest, Trichoplusia ni, assigning 90.6% of bases to one of 28 chromosomes and predicting 14,037 protein-coding genes. Chemoreception and detoxification gene families reveal T. ni-specific gene expansions that may explain its widespread distribution and rapid adaptation to insecticides. Transcriptome and small RNA data from thorax, ovary, testis, and the germline-derived Hi5 cell line show distinct expression profiles for 295 microRNA- and >393 piRNA-producing loci, as well as 39 genes encoding small RNA pathway proteins. Nearly all of the W chromosome is devoted to piRNA production, and T. ni siRNAs are not 2´-O-methylated. To enable use of Hi5 cells as a model system, we have established genome editing and single-cell cloning protocols. The T. ni genome provides insights into pest control and allows Hi5 cells to become a new tool for studying small RNAs ex vivo.

Keywords: Lepidoptera; T. ni; Tricoplusia ni; chromosomes; evolutionary biology; genes; genomics; insecticide resistance; piRNAs; siRNAs.


Conflict of interest statement

YF, YY, HZ, GF, JW, KQ, ZW, PZ No competing interests declared

Figures
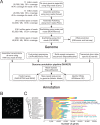
Figure 1.
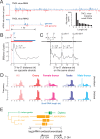
Figure 1.. Chromosomes and genes in the T. ni genome based on data from the Hi5 cell line.
(A) Genome assembly and annotation workflow. (B) An example of a DAPI-stained spread of Hi5 cell mitotic chromosomes used to determine the karyotype. (C) Phylogenetic tree and orthology assignment of T. ni with 18 arthropod and two mammalian genomes. Colors denote gene categories. The category 1:1:1 represents universal single-copy orthologs, allowing absence and/or duplication in one genome. N:N:N orthologs include orthologs with variable copy numbers across species, allowing absence in one genome or two genomes from different orders. Lepidoptera-specific genes are present in at least three of the four lepidopteran genomes; Hymenoptera-specific genes are present in at least one wasp or bee genome and at least one ant genome. Coleoptera-specific genes are present in both coleopteran genomes; Diptera-specific genes present in at least one fly genome and one mosquito genome. Insect indicates other insect-specific genes. Mammal-specific genes are present in both mammalian genomes. The phylogenetic tree is based on the alignment of 1:1:1 orthologs.
Figure 1—figure supplement 1.
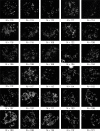
Figure 1—figure supplement 1.. Hi5 cell Karyotyping.
Thirty images showing the numbers of chromosomes (N) in Hi5 cells. N ranged from 103 to 122; mean ± S.D.=111.7 ± 5.45. Since lepidopteran cell lines are typically tetraploid, the haploid genome likely contains 28 (mean ± S.D.=27.9 ± 1.36) pairs of chromosomes.
Figure 1—figure supplement 2.
Figure 1—figure supplement 2.. Phylogenetic tree of 21 species showing the scale, branch lengths and bootstrap support.
Strict 1:1:1 orthologs were used to compute the phylogenetic tree using the maximum likelihood method. Black, branch length; red, bootstrap support.
Figure 1—figure supplement 3.
Figure 1—figure supplement 3.. Opsins in insects.
Figure 2.
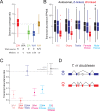
Figure 2.. T. ni males are ZZ and females are ZW.
(A) Normalized contig coverage in males and females. (B) Relative repeat content, gene density, transcript abundance (female and male thoraces), and piRNA density of autosomal, Z-linked, and W-linked contigs (ovary). (C) Multiple sequence alignment of the conserved region of the sex-determining gene masc among the lepidopteran species.
Figure 2—figure supplement 1.
Figure 2—figure supplement 1.. T. ni sex determination and dosage compensation.
(A) Genomic coverage comparison of Z-linked, W-linked and autosomal contigs. Contig coverage was shuffled 1,000,000 times to calculate the coverage ratio. Outliers are not shown. (B) Autosomal, Z-linked and W-linked transcript abundance in Hi5 cells and T. ni tissues. (C) Transcript abundance ratios of autosomal, Z-linked, and W-linked genes in Hi5 cells and T. ni tissues. Error bars represent 95% confidence interval estimated from 1000 bootstrap replicates. (D). Sex-specific splicing of T. ni doublesex pre-mRNA.
Figure 2—figure supplement 2.
Figure 2—figure supplement 2.. CpG ratios and transposons.
(A) Distribution of observed-to-expected CpG ratios in protein-coding genes (left panel) and in 500 bp genomic windows (right panel) in A. mellifera, B. mori, D. plexippus, D. melanogaster, P. xylostella, T. castaneum, and T. ni. (B) Proportion of the genome occupied by transposons versus transposon sequence divergence. Sequence divergence was calculated by comparing individual transposon copies with the corresponding consensus sequence (see Materials and methods). (C) Repeat content in lepidopteran genomes.
Figure 3.
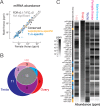
Figure 3.. miRNA expression in T. ni.
(A) Comparison of miRNA abundance in male and female T. ni thoraces. Solid circles, miRNAs with FDR < 0.1 and fold change >2. Outlined circles, all other miRNAs. (B) Comparison of the tissue distribution of the 44 most abundant miRNAs among T. ni ovaries, testes, and Hi5. (C) Heat map showing the abundance of miRNAs in (B). miRNAs are ordered according to abundance in ovary. Conservation status uses the same color scheme in (A).
Figure 4.
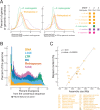
Figure 4.. siRNA.
(A) Distribution of siRNAs mapping to TNCL virus in the genomic (blue) and anti-genomic orientation (red). Inset: length distribution of TNCL virus-mapping small RNAs. (B) Distance between the 3′ and 5′ ends of siRNAs on opposite viral strands. (C) Distance between the 3′ and 5′ ends of siRNAs on the same viral strand. (D) Length distribution of small RNAs from unoxidized and oxidized small RNA-seq libraries. (E) Lepidopteran siRNAs are not 2′-O-methylated. The box plots display the ratio of abundance (as a fraction of all small RNAs sequenced) for each siRNA in oxidized versus unoxidized small RNA-seq libraries. The tree shows the phylogenetic relationships of the analyzed insects. Outliers are not shown.
Figure 4—figure supplement 1.
Figure 4—figure supplement 1.. T. ni siRNAs.
(A) siRNA length distributions for multiple insects in oxidized and unoxidized small RNA-seq libraries. (B) Length distribution of fully matched and tailed TNCL virus-siRNAs.
Figure 4—figure supplement 2.
Figure 4—figure supplement 2.. Loading asymmetry of siRNAs mapping to TNCL RNA1 (A) and RNA2 (B).
For each single-stranded siRNA species, we searched for siRNAs on the other strand that when paired produce a typical siRNA duplex with two-nucleotide overhanging 3′ ends.
Figure 5.
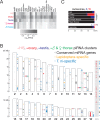
Figure 5.. piRNAs and miRNAs in the T. ni genome.
(A) Abundance of mRNAs encoding piRNA pathway proteins) in Hi5 cells, ovary, testis, and thorax. (B) Ideogram displaying the positions of miRNA genes (arrowheads) and piRNA clusters in the T. ni genome. Color-coding reports tissue expression for Hi5 cells, ovaries, testis, and thorax. Contigs that cannot be placed onto chromosome-length scaffolds are arbitrarily concatenated and are marked ‘Un.’ (C) Distribution of piRNAs among the autosomes, Z, and W chromosomes in Hi5 cells, ovary, testis, and female and male thorax, compared with the fraction of the genome corresponding to autosomes, W, and Z chromosomes.
Figure 5—figure supplement 1.
Figure 5—figure supplement 1.. piRNA abundance (ppm) along the most productive piRNA cluster.
Top, fixed scale (some data clipped); bottom, auto-scaled.
Figure 5—figure supplement 2.
Figure 5—figure supplement 2.. T. ni piRNAs.
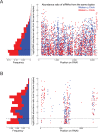
(A) piRNA clusters tend to produce piRNAs that are antisense to transposons. The x-axis represents the ratio of piRNAs from the plus strand to piRNAs from the minus strand, with the dotted lines indicating twofold difference. The y-axis indicates the ratio of transposons lengths on the plus strand over transposon length on the minus strand. The solid line indicates regression line and shading indicates 95% confidence interval by LOWESS. Boxplot shows fractions of antisense transposons (i.e. transposons inserted opposite to the direction of piRNAs precursor transcription) in dual- and uni-strand clusters. Outliers are not shown. Wilcoxon rank-sum test. (B) piRNA densities on autosomal, Z-linked and W-linked contigs in Hi5 cells, ovary, testis, and female and male thorax. (C) Abundance of piRNAs from putative W-linked genes.
Figure 6.
Figure 6.. T. ni piRNAs.
(A) Hi5-specific piRNA clusters contain younger transposon copies. RC, rolling-circle transposons; LINE, Long interspersed nuclear elements; LTR, long terminal repeat retrotransposon; DNA, DNA transposon. (B) Comparison of piRNA abundance per cluster in female and male thorax. (C) piRNA precursors are rarely spliced. The number of introns supported by exon-exon junction-mapping reads is shown for protein-coding genes and for piRNA clusters for each tissue or cell type. (D) piRNA precursors are inefficiently spliced. Splicing efficiency is defined as the ratio of spliced over unspliced reads. Splice sites were categorized into those inside and outside piRNA clusters. Outliers are not shown.
Figure 6—figure supplement 1.
Figure 6—figure supplement 1.. T. ni piRNA clusters.
(A) Comparison of piRNA abundance (ppm) from ovary and Hi5 piRNA-producing loci and from ovary and testis piRNA-producing loci. (B) piRNA cluster lengths in T. ni ovary, testis, thorax, and Hi5 cells. (C) Motifs around intron boundaries of predicted protein-coding gene models within and outside of piRNA clusters.
Figure 7.
Figure 7.. Genome editing in Hi5 cells.
(A) Strategy for using Cas9/sgRNA RNPs to generate a loss-of-function TnPiwi deletion allele. Red, protospacer-adjacent motif (PAM); blue, protospacer sequence. Arrows indicate the diagnostic forward and reverse primers used in PCR to detect genomic deletions (Δ). Sanger sequencing of the ~1700 bp PCR products validated the TnPiwi deletions. (B) An example of PCR analysis of a TnPiwi deletion event. (C) Strategy for using Cas9/sgRNA RNPs and a single-stranded DNA homology donor to insert EGFP and an HA-tag in-frame with the vasa open-reading frame. (D) An example of PCR analysis of a successful HDR event. DNA isolated from wild type (WT) and FACS-sorted, EGFP-expressing Hi5 cells (HDR) were used as templates.
Figure 8.
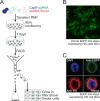
Figure 8.. Hi5 cells contain nuage.
(A) Schematic of single-clone selection of genome-edited Hi5 cells using the strategy described in Figure 7C. (B) A representative field of Hi5 cells edited to express EGFP-HA-Vasa from the endogenous locus. (C) A representative image of a fixed, EGFP-HA-Vasa-expressing Hi5 cell stained with DAPI, anti-EGFP and anti-HA antibodies. EGFP and HA staining colocalize in a perinuclear structure consistent with Vasa localizing to nuage.

References

    1. Abe H, Fujii T, Tanaka N, Yokoyama T, Kakehashi H, Ajimura M, Mita K, Banno Y, Yasukochi Y, Oshiki T, Nenoi M, Ishikawa T, Shimada T. Identification of the female-determining region of the W chromosome in Bombyx mori. Genetica. 2008;133:269–282. doi: 10.1007/s10709-007-9210-1. - DOI - PubMed
    1. Abe H, Mita K, Yasukochi Y, Oshiki T, Shimada T. Retrotransposable elements on the W chromosome of the silkworm, Bombyx mori. Cytogenetic and Genome Research. 2005;110:144–151. doi: 10.1159/000084946. - DOI - PubMed
    1. Agrawal N, Dasaradhi PV, Mohmmed A, Malhotra P, Bhatnagar RK, Mukherjee SK. RNA interference: biology, mechanism, and applications. Microbiology and Molecular Biology Reviews. 2003;67:657–685. doi: 10.1128/MMBR.67.4.657-685.2003. - DOI - PMC - PubMed
    1. Ai J, Zhu Y, Duan J, Yu Q, Zhang G, Wan F, Xiang ZH. Genome-wide analysis of cytochrome P450 monooxygenase genes in the silkworm, Bombyx mori. Gene. 2011;480:42–50. doi: 10.1016/j.gene.2011.03.002. - DOI - PubMed
    1. Altschul SF, Gish W, Miller W, Myers EW, Lipman DJ. Basic local alignment search tool. Journal of Molecular Biology. 1990;215:403–410. doi: 10.1016/S0022-2836(05)80360-2. - DOI - PubMed

Publication types

LinkOut - more resources