

Effect of Nanoparticle Surface Coating on Cell Toxicity and Mitochondria Uptake
- PMID: 29377103
- PMCID: PMC6800125
- DOI: 10.1166/jbn.2017.2337
Effect of Nanoparticle Surface Coating on Cell Toxicity and Mitochondria Uptake
Abstract
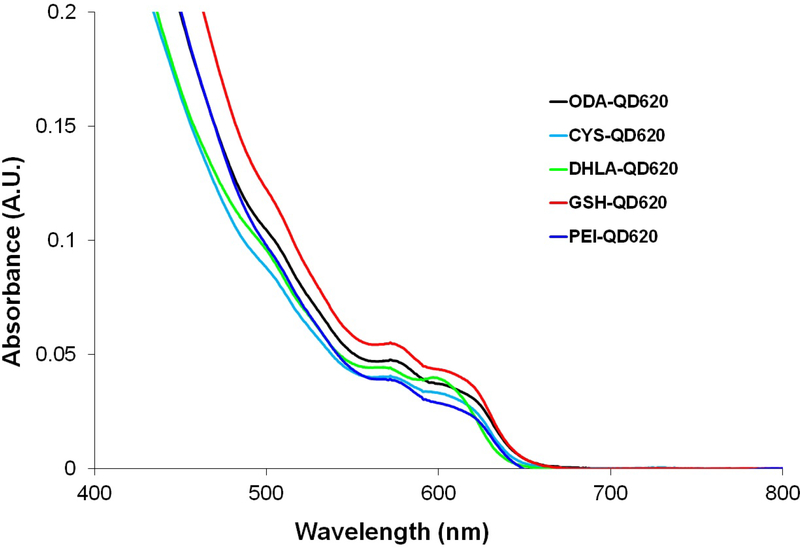
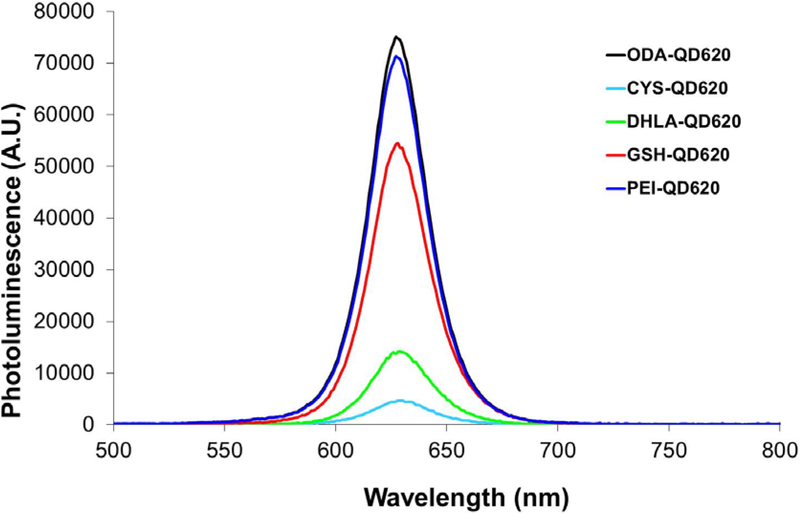
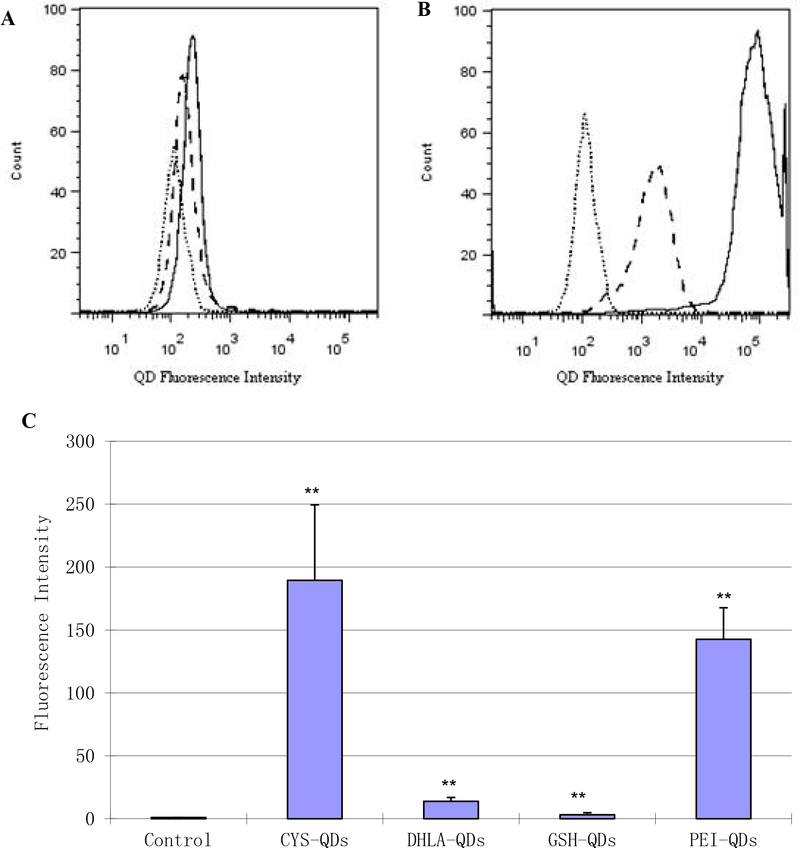
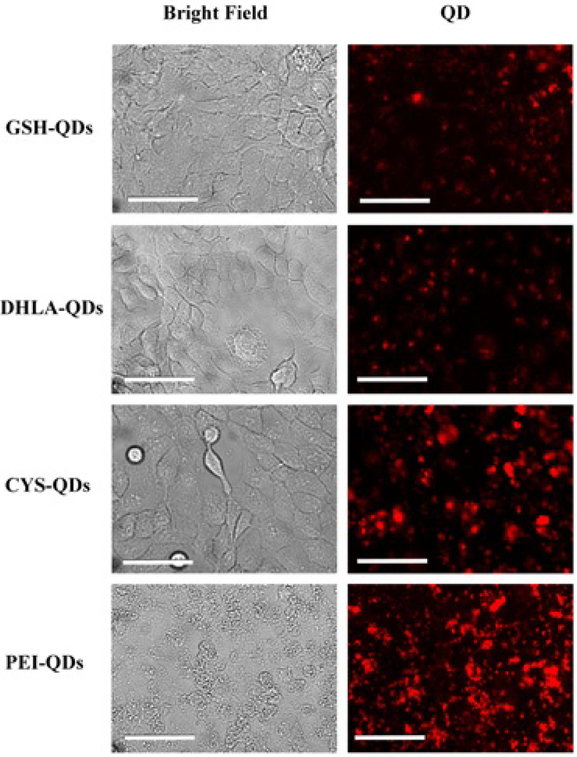
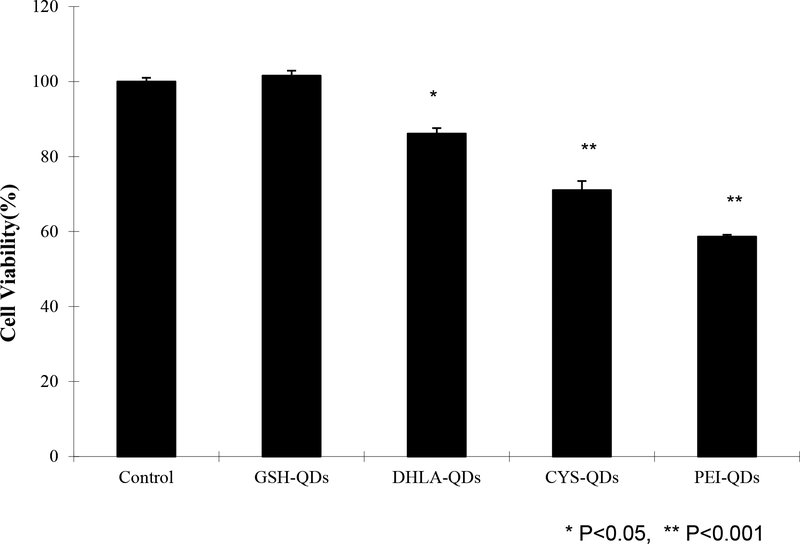
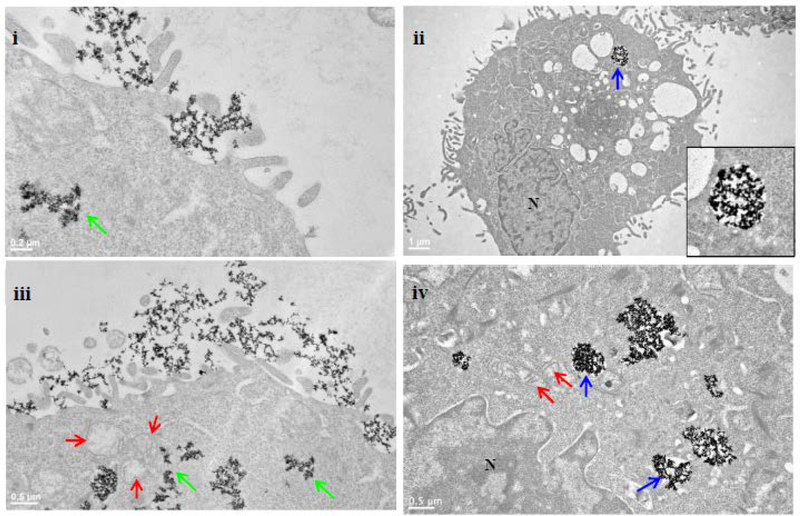
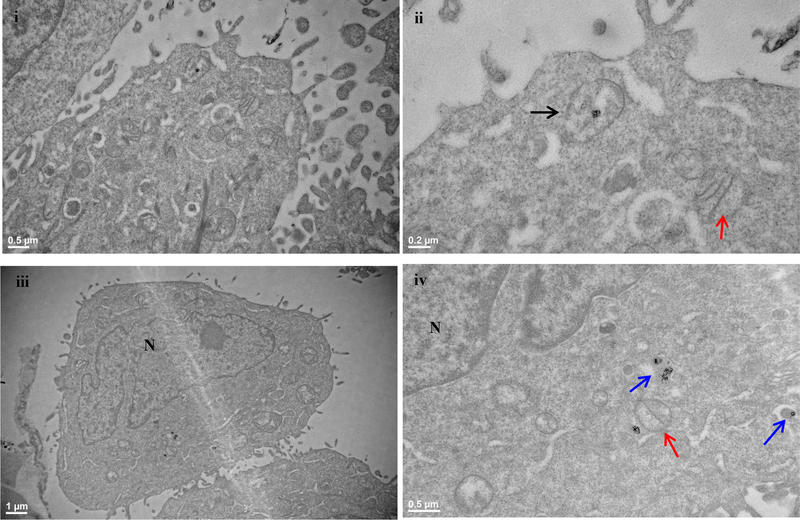
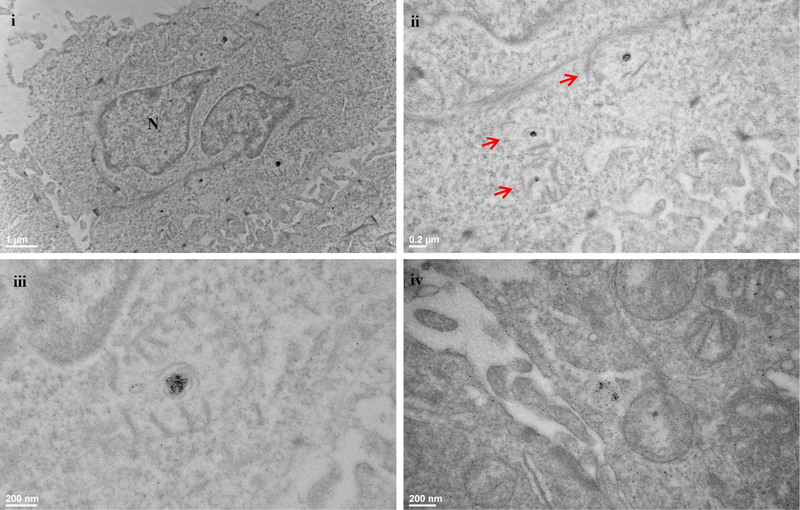
We report on the effect of surface charge and the ligand coating composition of CdSe/ZnS core/shell quantum dot (QD) nanoparticles on human keratinocyte toxicity using fluorescent microscopy, flow cytometry, transmission electron microscopy. Two commonly reported positive charged (cysteamine, polyethylenimine) and two negative charged (glutathione, dihydrolipoic acid) ligands were studied. The QDs were fully characterized by UV-vis absorption spectroscopy, fluorescence emission spectroscopy, dynamic light scattering and zeta potential. Differences in surface coatings and charges were evaluated against cellular uptake, ROS generation, cytotoxicity, and mitochondrial targeting. Results show that the negative charged QDs coated with GSH exhibit excellent water solubility, high quantum yield and low cytotoxicity. Ligand composition is more important in ROS generation than surface charge whereas surface charge is an important driver of cytotoxicity. Most importantly we observe the selective accumulation of glutathione coated QDs in vesicles in the mitochondria matrix. This observation suggests a new strategy for developing mitochondria-targeted nanomaterials for drug/gene delivery.
Keywords: Quantum Dots; Keratinoyctes; Endocytosis; Inracellular Localization; Mitochondria.
Figures


Similar articles
-
Thiol antioxidant-functionalized CdSe/ZnS quantum dots: synthesis, characterization, cytotoxicity.J Biomed Nanotechnol. 2013 Mar;9(3):382-92. doi: 10.1166/jbn.2013.1561. J Biomed Nanotechnol. 2013. PMID: 23620993 Free PMC article.
-
Cellular uptake, elimination and toxicity of CdSe/ZnS quantum dots in HepG2 cells.Biomaterials. 2013 Dec;34(37):9545-58. doi: 10.1016/j.biomaterials.2013.08.038. Epub 2013 Sep 5. Biomaterials. 2013. PMID: 24011712
-
The role of surface chemistry in determining in vivo biodistribution and toxicity of CdSe/ZnS core-shell quantum dots.Biomaterials. 2013 Nov;34(34):8741-55. doi: 10.1016/j.biomaterials.2013.07.087. Epub 2013 Aug 9. Biomaterials. 2013. PMID: 23932294
-
Cytotoxicity of quantum dots used for in vitro cellular labeling: role of QD surface ligand, delivery modality, cell type, and direct comparison to organic fluorophores.Bioconjug Chem. 2013 Sep 18;24(9):1570-83. doi: 10.1021/bc4001917. Epub 2013 Aug 16. Bioconjug Chem. 2013. PMID: 23879393
-
Stability and fluorescence quantum yield of CdSe-ZnS quantum dots--influence of the thickness of the ZnS shell.Ann N Y Acad Sci. 2008;1130:235-41. doi: 10.1196/annals.1430.021. Ann N Y Acad Sci. 2008. PMID: 18596353 Review.
Cited by
-
Cytotoxicity of InP/ZnS Quantum Dots With Different Surface Functional Groups Toward Two Lung-Derived Cell Lines.Front Pharmacol. 2018 Jul 13;9:763. doi: 10.3389/fphar.2018.00763. eCollection 2018. Front Pharmacol. 2018. PMID: 30057549 Free PMC article.
-
Cardiotoxicity of Intravenously Administered CdSe/ZnS Quantum Dots in BALB/c Mice.Front Pharmacol. 2019 Oct 8;10:1179. doi: 10.3389/fphar.2019.01179. eCollection 2019. Front Pharmacol. 2019. PMID: 31649542 Free PMC article.
-
Surface Charge Affects the Intracellular Fate and Clearance Dynamics of CdSe/ZnS Quantum Dots in Macrophages.Nanomaterials (Basel). 2025 Aug 3;15(15):1189. doi: 10.3390/nano15151189. Nanomaterials (Basel). 2025. PMID: 40801727 Free PMC article.
-
In vivo Comparison of the Biodistribution and Toxicity of InP/ZnS Quantum Dots with Different Surface Modifications.Int J Nanomedicine. 2020 Mar 20;15:1951-1965. doi: 10.2147/IJN.S241332. eCollection 2020. Int J Nanomedicine. 2020. PMID: 32256071 Free PMC article.
-
Recent Advances in Mitochondria-Targeted Gene Delivery.Molecules. 2018 Sep 11;23(9):2316. doi: 10.3390/molecules23092316. Molecules. 2018. PMID: 30208599 Free PMC article. Review.
References
-
- Chan WC, Maxwell DJ, Gao X, Bailey RE, Han M, Nie S, Luminescent Quantum Dots for Multiplexed Biological Detection and Imaging. Curr. Opin. Biotechnol 13, 40–46 (2002). - PubMed
-
- Wang Y, Chen L, Quantum Dots, Lighting up the Research and Development of Nanomedicine. Nanomedicine 7, 385–402 (2011). - PubMed
-
- Hutter E, Maysinger D, Gold Nanoparticles and Quantum Dots for Bioimaging. Microsc Res Tech. 2011, 74, 592–604. - PubMed
Publication types
MeSH terms
Substances
Grants and funding
LinkOut - more resources
Full Text Sources