. 2018 Aug;16(8):1488-1501.
doi: 10.1111/pbi.12891. Epub 2018 Mar 8.

Grapevine VpPR10.1 functions in resistance to Plasmopara viticola through triggering a cell death-like defence response by interacting with VpVDAC3

Affiliations

Grapevine VpPR10.1 functions in resistance to Plasmopara viticola through triggering a cell death-like defence response by interacting with VpVDAC3

Hui Ma et al. Plant Biotechnol J. 2018 Aug.

Abstract

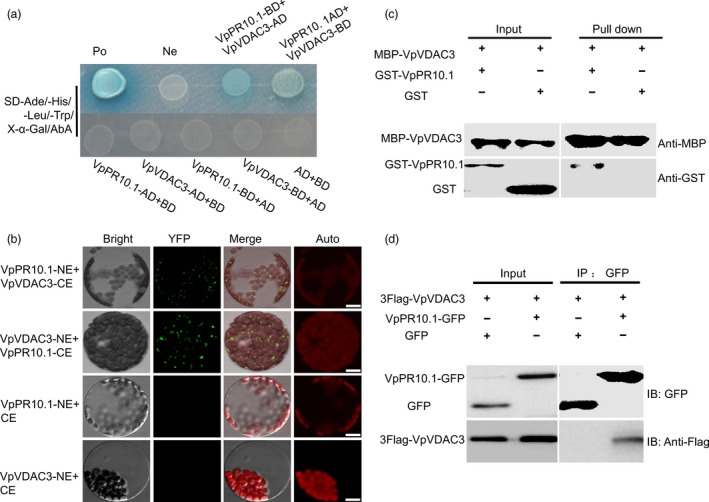
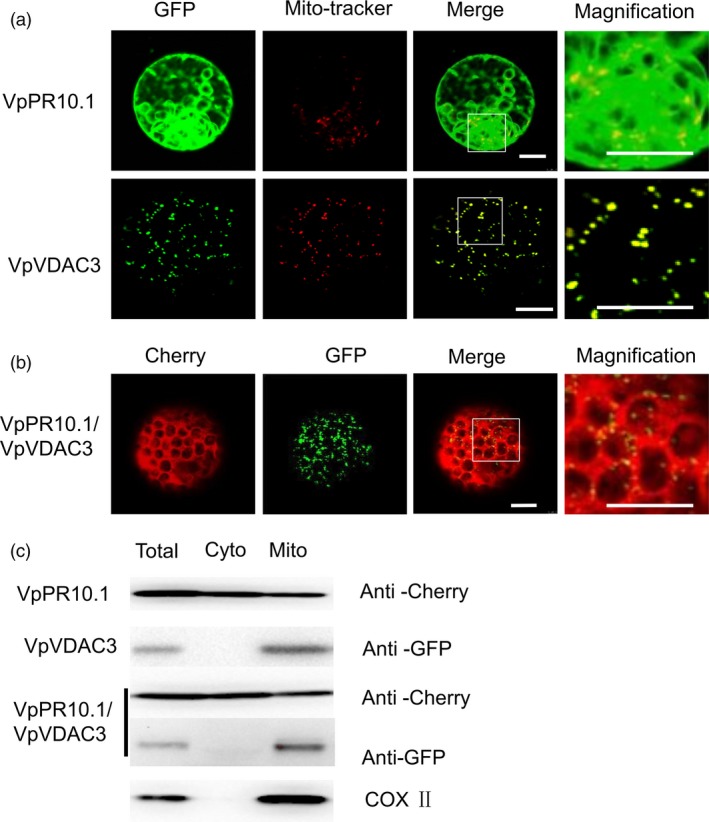
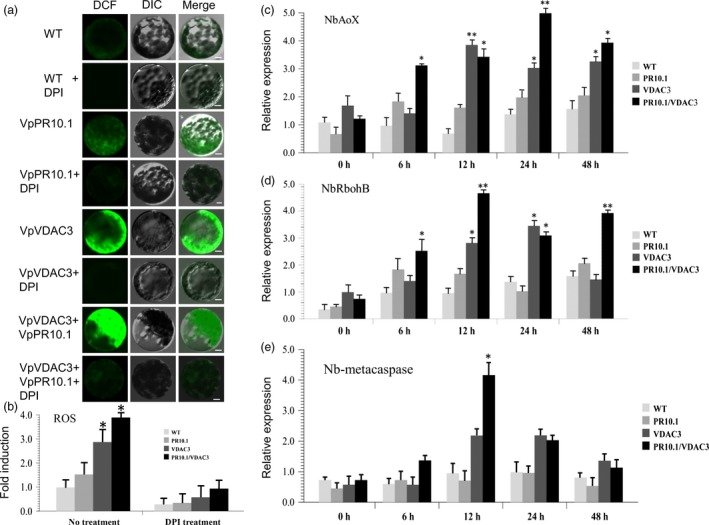
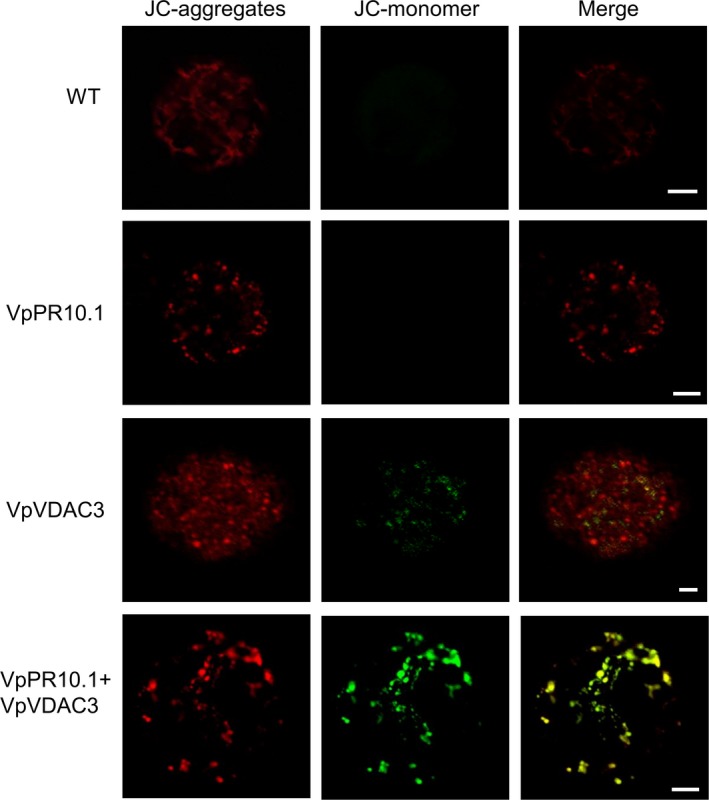
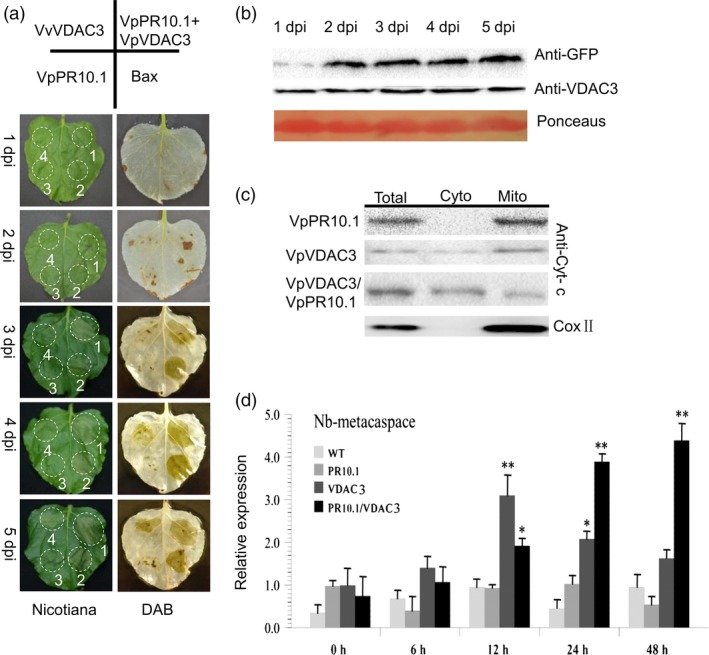
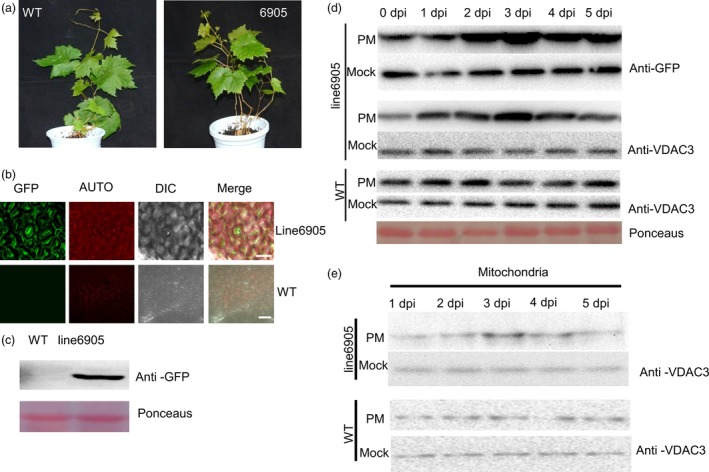
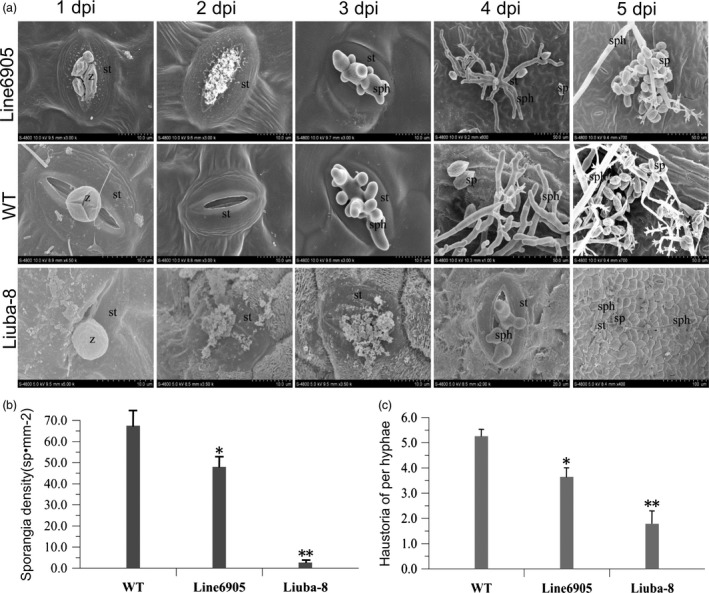
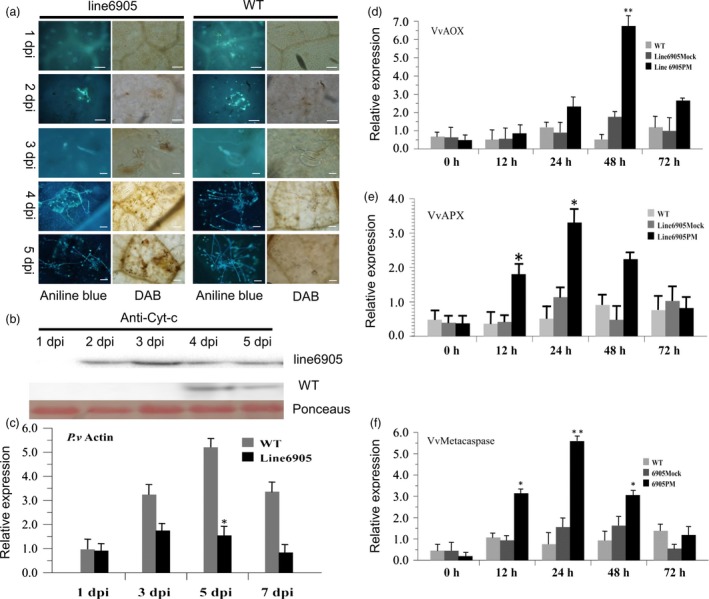
As one of the most serious diseases in grape, downy mildew caused by Plasmopara viticola is a worldwide grape disease. Much effort has been focused on improving susceptible grapevine resistance, and wild resistant grapevine species are important for germplasm improvement of commercial cultivars. Using yeast two-hybrid screen followed by a series of immunoprecipitation experiments, we identified voltage-dependent anion channel 3 (VDAC3) protein from Vitis piasezkii 'Liuba-8' as an interacting partner of VpPR10.1 cloned from Vitis pseudoreticulata 'Baihe-35-1', which is an important germplasm for its resistance to a range of pathogens. Co-expression of VpPR10.1/VpVDAC3 induced cell death in Nicotiana benthamiana, which accompanied by ROS accumulation. VpPR10.1 transgenic grapevine line showed resistance to P. viticola. We conclude that the VpPR10.1/VpVDAC3 complex is responsible for cell death-mediated defence response to P. viticola in grapevine.

Keywords: Plasmopara viticola; ROS; Vitis pseudoreticulata; PR10; grapevine; voltage-dependent anion channel.


Figures

Figure 1
Figure 1
VpPR10.1 interacts with VpVDAC3. (a)Yeast two‐hybrid assay. pGBKT7 or pGADT7 plasmid containing VpPR10.1 and VpVDAC3 was transformed into Y2H Gold. Combinations of the (AD/T) with BD/p53 and BD/Lam were used as positive and negative controls. (b) Bimolecular fluorescence complementation (BiFC) assay in vivo. Merged fluorescent and visible light images were taken. Bars = 10 μm. Auto, chloroplast auto‐fluorescence. (c) Pull‐down assay. The presence or absence of each protein in the final mixture is indicated as + or −, respectively. (d) Co‐IP and immunoblotting (IB) of GFP/Flag‐VpVDAC3 and VpPR10.1GFP/Flag‐VpVDAC3 were co‐expressed in Nicotiana benthamiana leaves. Flag antibodies were used for the detection of immunoprecipitated VpPR10.1‐GFP and Flag‐VpVDAC3.
Figure 2
Figure 2
Subcellular localization of VpPR10.1 and VpVDAC3. The visible fluorescence indicates gene localization in Nicotiana benthamiana protoplasts. (a) Localization of VpPR10.1GFP, VpVDAC3GFP. Mito‐Tracker Red (Invitrogen) was stained to mark mitochondria. Bars = 10 μm. (b)Co‐localization of the VpPR10.1 and VpVDAC3 in N. benthamiana protoplasts transformed with the couple constructs of cherry‐VpPR10.1 and VpVDAC3GFP. Bars = 10 μm. (c) Mitochondria were extracted from transformed protoplasts and detected by immunoblotting. Total, no separated protein; Cyto, nonmitochondrial protein; Mito, mitochondrial enriched protein. COX II was present as mitochondrial marker protein.
Figure 3
Figure 3
ROS Detection of Transient Expression of VpVDAC3, VpPR10.1, VpVDAC3/VpPR10.1 in N. benthamiana. Before the separation of protoplasts, Flag‐VDAC3, Flag‐VpPR10.1 and Flag‐VpVDAC3/Flag‐VpPR10.1 were transiently expressed by Agrobacterium infiltration in N. benthamiana leaves. (a) Protoplasts isolated from the indicated transient expression leaves, and protoplast lines were marked by DCFHDA. The green fluorescence represents intracellular ROS level; (b) Each sample was accompanied by pretreatment of ROS inhibitor DPI. Bars = 10 μm. (c, d, e) Quantification of RTPCR analysis of ROS‐related genes NbAOX, NbRbohB, NbAPX; values represent means and SEs of three biological replicates. * and ** indicate P < 0.05 and P < 0.01, compared to GFP control (t‐test).
Figure 4
Figure 4
Depolarization of Mitochondria by Transient Expression VpVDAC3/VpPR10.1 in Nicotiana benthamiana. Mitochondrial depolarization. Living protoplasts were separated from N. benthamiana leaves that transiently expressed indicated genes. Decreased mitochondria membrane polarization results in the formation of JC‐1 aggregate to monomer which results in shifts of red/orange to green. Bars = 10 μm.
Figure 5
Figure 5
Transient Expression of VpVDAC3 or VpVDAC3/VpPR10.1 in Nicotiana benthamiana induces cell death. Phenotypic and physiological analyses of VpPR10.1 and VpVDAC3 following DAB staining. (a) Phenotypes of VpVDAC3, VpPR10.1, VpVDAC3/VpPR10.1 and Bax were all injected into one N. Benthamiana leaves. The bluish colour of DAB staining represents accumulated H2O2. (b) Visualization of VpVDAC3, VpPR10.1 protein by Western blotting in Agro‐infiltration N. benthamiana leaves. Ponceaus staining stand for control loading. (c) Western blot for detecting cytochrome c after expression with indicator gene in N. Benthamiana leaves. Total, nonseparated protein; Cyto, nonmitochondrial protein; Mito, mitochondrial enriched protein. COX II was present as mitochondrial marker protein. (d) Quantification of RTPCR analysis of cell death inducing gene Nb‐MCA1 expression. Values mean ± SE (n = 3) of three independent biological repeats. Asterisks indicate significant difference between each gene and GFP control, *P < 0.05; **P < 0.01 (t‐test).
Figure 6
Figure 6
Characterization and Expression Pattern Analysis of VpPR10.1 Transgenic Grapevine. (a) Phenotypic study of transgenic line 6905 and wild type. VpPR10.1 transgenic line 6905 and WT grown in the feeding block for 40 days (left, ‘Thompson Seedless’, right, transgenic line 6905). Bars = 1 cm. (b) Direct GFP fluorescence observation of grape leaf abaxial surface from transgenic line 6905 and WT using confocal microscope. Bars = 50 μm. (c) Western blot showing expression levels of insert gene VpPR10.1 with GFP tag in transgenic line 6905 and WT. Ponceaus indicates control loading. (d) Expression patterns of VpPR10.1 and VpVDAC3 in transgenic line 6905 under infection of Plasmopara viticola. PM, P. viticola induction; Mock, inoculated with double distilled water. Ponceaus indicates control loading. (e) Expression patterns of VpVDAC3 in enriched mitochondria from transgenic line 6905 under post of P. viticola. Protein was detected by Western blot using anti‐VDAC3 as described in the experiment and procedure section.
Figure 7
Figure 7
Overexpression of VpPR10.1 limits the development of Plasmopara viticola. The sporangia of P. viticola were attached to the back of leaf discs surface from WT and the overexpressing VpPR10.1 line 6905. P. viticola highly resistant Vitis piasezkii ‘Liuba‐8’ was used as positive control. (a) Scanning electron microscopy observation of VpPR10.1 transgenic line 6905 and WT leaves inoculated with P. viticola from 1 to 5 dpi. Images represented three independent experiments, z, zoospores encystment; st, stomata; sp, sporangia; sph, sporangiophores; hy, hyphae. (b) Average sporangia density of P. viticola from different genotypes at 5 dpi. Error bars indicate SE (n = 3) from three independent biological replicates (*< 0.05 and **< 0.01, t‐test). (c) Number of haustoria per hyphae on a total of 20 infected discs from different grapes at 48 hpi. Error bars indicate SE from three independent biological replicates (*< 0.05 and **< 0.01, t‐test).
Figure 8
Figure 8
VpPR10.1 overexpression enhances H2O2 accumulation during infection. (a) Fluorescence micrographs of oomycete development were stained with aniline blue (left); H2O2 accumulation was stained with DAB. Bar = 50 μm. (b) Western blot for detecting the cytochrome c in cytoplasm after inoculation with Plasmopara viticola for 1–5 dpi in transgenic line 6905; ponceaus indicates control loading. (c) RTPCR was carried out to evaluate the actin gene of P. viticola in VpPR10.1 transgenic line 6905 and wild‐type Vitis vinifera ‘Thompson Seedless’. Vitis 18s rRNA was used as reference gene (*P < 0.05) (t‐test). (d, e) The expression level of ROS‐related gene VvAOX, VvAPX in transgenic line 6905 and WT after inoculation with P. viticola at indicate times. Each value is the mean ± SE of three independent biological determinations. Asterisks indicate significant difference from mock control, *P < 0.05; **P < 0.01 (t‐test). (f) The expression level of apoptosis‐related gene (type II metacaspase) Vvmetacaspase5 (Zhang et al., 2013) in transgenic line 6905 and WT after inoculation with P. viticola at indicated times. Asterisks indicate significant difference from the mock control, *P < 0.05, **P < 0.01(t‐test).

Similar articles

Cited by

References

    1. Abu‐Hamad, S. , Sivan, S. and Shoshan‐Barmatz, V. (2006) The expression level of the voltage‐dependent anion channel controls life and death of the cell. Proc. Natl Acad. Sci. USA, 103, 5787–5792. - PMC - PubMed
    1. Al Bitar, F. , Roosens, N. , Smeyers, M. , Vauterin, M. , Van Boxtel, J. , Jacobs, M. and Homblé, F. (2003) Sequence analysis, transcriptional and posttranscriptional regulation of the rice vdac family. Biochim. Biophys. Acta. 1625, 43–51. - PubMed
    1. Azoulay‐Zohar, H. , Israelson, A. , Salah, A.H. and Shoshan‐Barmatz, V. (2004) In self‐defence, hexokinase promotes voltage‐dependent anion channel closure and prevents mitochondria‐mediated apoptotic cell death. Bio Protoc. 377, 347–355. - PMC - PubMed
    1. Benz, R. (1994) Permeation of hydrophilic solutes through mitochondrial outer membranes, review on mitochondrial porins. Biochem. Biophys. Acta. 1197, 167–196. - PubMed
    1. Bittel, P. and Robatzek, S. (2007) Microbe‐associated molecular patterns (MAMPs) probe plant immunity. Curr. Opin. Plant Biol. 10, 335–341. - PubMed

Publication types

MeSH terms

Substances