. 2018;14(2):283-295.
doi: 10.1080/15548627.2017.1409926. Epub 2018 Jan 29.

EGFRvIII expression triggers a metabolic dependency and therapeutic vulnerability sensitive to autophagy inhibition

Affiliations

EGFRvIII expression triggers a metabolic dependency and therapeutic vulnerability sensitive to autophagy inhibition

Barry Jutten et al. Autophagy. 2018.

Abstract

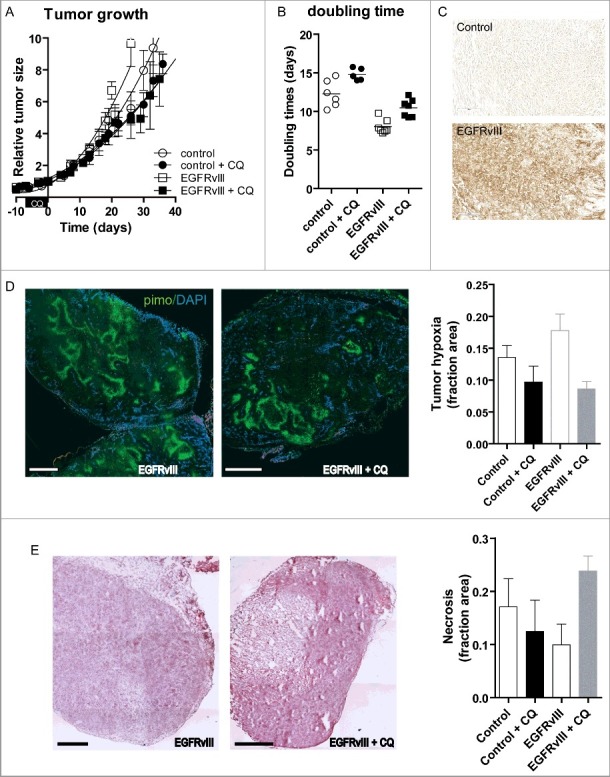
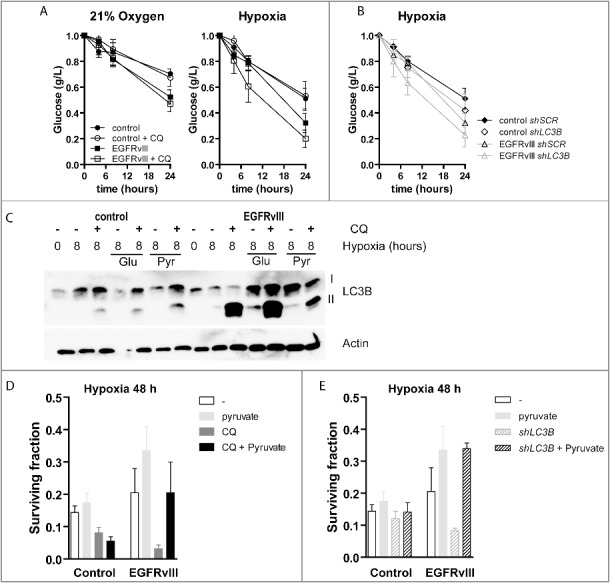
Expression of EGFRvIII is frequently observed in glioblastoma and is associated with increased cellular proliferation, enhanced tolerance to metabolic stresses, accelerated tumor growth, therapy resistance and poor prognosis. We observed that expression of EGFRvIII elevates the activation of macroautophagy/autophagy during starvation and hypoxia and explored the underlying mechanism and consequence. Autophagy was inhibited (genetically or pharmacologically) and its consequence for tolerance to metabolic stress and its therapeutic potential in (EGFRvIII+) glioblastoma was assessed in cellular systems, (patient derived) tumor xenopgrafts and glioblastoma patients. Autophagy inhibition abrogated the enhanced proliferation and survival advantage of EGFRvIII+ cells during stress conditions, decreased tumor hypoxia and delayed tumor growth in EGFRvIII+ tumors. These effects can be attributed to the supporting role of autophagy in meeting the high metabolic demand of EGFRvIII+ cells. As hypoxic tumor cells greatly contribute to therapy resistance, autophagy inhibition revokes the radioresistant phenotype of EGFRvIII+ tumors in (patient derived) xenograft tumors. In line with these findings, retrospective analysis of glioblastoma patients indicated that chloroquine treatment improves survival of all glioblastoma patients, but patients with EGFRvIII+ glioblastoma benefited most. Our findings disclose the unique autophagy dependency of EGFRvIII+ glioblastoma as a therapeutic opportunity. Chloroquine treatment may therefore be considered as an additional treatment strategy for glioblastoma patients and can reverse the worse prognosis of patients with EGFRvIII+ glioblastoma.

Keywords: Autophagy; EGFR; EGFRvIII; chloroquine; glioblastoma; hypoxia; metabolic stress radiotherapy; starvation.


Figures

Figure 1.
Figure 1.
EGFRvIII-expressing cells display increased autophagy activation and dependence during serum-starved conditions. (A) EGFRvIII-expressing cells display more and larger autophagosomes during starvation as assessed by immunofluorescence (nuclei [DAPI] in blue, LC3B in green). Scale bars: 10 μm. Immunoblot analysis of control and EGFRvIII-expressing cells reveal elevated autophagic flux during serum-starved conditions in EGFRvIII-expressing U373 (B) and U87-MG (C) cells. Proliferation curves under normal (D) and serum-starved (E) conditions show that CQ (5 µg/ml) does not influence growth under normal conditions, but can abrogate the growth advantage of EGFRvIII-expressing cells during starvation. n = 3, mean ± SEM. Clonogenic survival assessment after serum starvation with or without addition of CQ (F) or expression of a shRNA targeting LC3B (G) indicate that the elevated survival advantage of EGFRvIII-expressing cells is autophagy dependent. n = 3, mean ± SEM. SCR, scrambled control.
Figure 2.
Figure 2.
Inhibition of the elevated autophagic response in EGFRvIII-expressing cells abrogates their survival advantage during hypoxia. Immunoblot analysis indicates elevated autophagy activation in EGFRvIII-expressing U373 (A) and U87 (B) cells during hypoxia. (C) Tandem GFP-mCherry-LC3B expression indicates elevated autophagic flux in EGFRvIII+ cells during hypoxia (24 h O2<0.02%). Scale bars: 2 μm. Autophagy inhibition either through CQ addition (5 µg/ml) (D) or shRNA expression directed against LC3B (E) abrogates the survival advantage of EGFRvIII-expressing cells as assessed by clonogenic survival assay. n = 3, mean ± SEM (F) Targeting ATG7 through expression of a shRNA (G) or ULK1 through expression of dominant negative ULK1K46I results in loss of survival advantage of EGFRvIII+ cells as determined by clonogenic survival assay after 48 h hypoxia (O2<0.02%). n = 3, mean ± SEM (H) EGFR and ERGFRvIII expression of BS153 and DKMG cell populations. Autophagic flux determination in (I) BS153 and (J) DKMG cells during hypoxia. Tandem GFP-mCherry-LC3B expression indicates elevated autophagic flux in EGFRvIII+ (K) BS153 and (L) DKMG cells during hypoxia (24 h O2<0.02%). Scale bars: 2 μm. Autophagy inhibition through CQ addition (5 µg/ml) abrogates the survival advantage of EGFRvIII+ (M) BS153 and (N) DKMG cells as assessed by crystal violet staining after hypoxia exposure. n = 3, mean ± SEM.
Figure 3.
Figure 3.
CQ treatment reduces tumor growth and tumor hypoxia and increases tumor necrosis in EGFRvIII-expressing tumors. (A) Growth curves of control U373 xenografts (open circles, n = 6) or treated from d −7 to 0 with CQ (60 mg/kg) (filled circles, n = 5) and EGFRvIII-expressing U373 xenografts (open squares, n = 7) treated with CQ (filled squares, n = 7). (B) Doubling times of the corresponding tumors. (C) Immunohistochemical staining for EGFRvIII on control (upper panel) and EGFRvIII-expressing xenografts (lower panel). Scale bars: 2 mm. (D) (Left panel) Micrographs of pimonidazole-DAPI staining prior to and after 7 d CQ treatment on EGFRvIII-expressing tumors. (Right panel) Quantification of the tumor hypoxic fraction (control n = 6, control + CQ n = 6, EGFRvIII n = 5, EGFRvIII + CQ n = 5). (E) (Left panel) Micrographs of hematoxylin and eosin staining prior to and after 7 d CQ treatment on EGFRvIII-expressing tumors. (Right panel) Quantification of tumor necrosis (control n = 6, control + CQ n = 6, EGFRvIII n = 5, EGFRvIII + CQ n = 5).
Figure 4.
Figure 4.
CQ treatment sensitizes EGFRvIII-expressing tumors to irradiation. (A) Growth curves of U373 xenografts: untreated (dashed lines; control [blue, n = 6], EGFRvIII[(red, n = 7]), treated with a single, tumor-specific dose of 10 Gy at t = 0 (interrupted line; control [blue, n = 8], EGFRvIII [red, n = 7]) or irradiated after 7 d CQ (60 mg/kg) pre-treatment from t = −7 to t = 0 and irradiated with a single, tumor-specific dose of 10 Gy at t = 0 (solid lines; control [blue, n = 9], EGFRvIII [red n = 11]). (B) Kaplan-Meier representations of the time to reach 4x the treated volume (from t = 0). Immunohistochemical staining for (C) EGFRvIII (scale bar: 50 μm) and (D) pimonidazole of PDX (scale bar: 2 mm), indicating EGFRvIII positivity and a substantial hypoxic fraction. (E) Growth curves of the PDX untreated (black closed circles, n = 5), treated with CQ (60 mg/kg) for 7 d from t = −7 to t = 0 (open circles, n = 5), treated with a single, tumor-specific dose, of 10 Gy at t = 0 (gray closed circles, n = 4) and treated with CQ (60 mg/kg) for 7 d from t = −7 to t = 0 followed by a single, tumor-specific dose, of 10 Gy at t = 0 (gray open circles, n = 5). (F) Kaplan-Meier representations of the time to reach 4x the treated volume (from t = 0).
Figure 5.
Figure 5.
EGFRvIII-expressing cells require autophagy to meet high metabolic demand. (A) Glucose utilization by control and EGFRvIII-expressing U373 cells under ambient (left) or hypoxic (O2<0.02%) (right) conditions with or without addition of CQ (5 µg/ml). n = 3, mean ± SEM. (B) Glucose consumption after expression of a control shRNA or a shRNA targeting LC3B. n = 3, mean ± SEM (C) Autophagic flux determination in control and EGFRvIII-expressing cells after 8-h hypoxia exposure with additional glucose or methyl pyruvate supplementation (5 mM). (D) Clonogenic survival after 48 h hypoxia (O2<0.02%) exposure in the presence of CQ, methyl pyruvate or CQ and pyruvate. (O2<0.02%) n = 3, mean ± SEM. (E) Clonogenic survival after 48-h hypoxia (O2<0.02%) exposure in control and LC3B-depleted cells with pyruvate supplemented n = 3, mean ± SEM.
Figure 6.
Figure 6.
Patients with EGFRvIII-expressing GBM benefit most from concurrent CQ treatment. (A) Micrographs of immunohistochemically stained biopsy slides of a negative (left) and EGFRvIII-expressing tumors (middle and right). Scale bar: 100 μm. (B) Kaplan-Meier survival plots of 61 GBM patients after TMZ-radiotherapy treatment, separated based on EGFRvIII expression. (C) Survival plot of 43 GBM patients categorized for EGFRvIII status and CQ treatment. Patients with an EGFRvIII-positive tumor benefit substantially from CQ treatment.

References

    1. Lemmon MA, Bu Z, Ladbury JE, Zhou M, Pinchasi D, Lax I, Engelman DM, Schlessinger J. Two EGF molecules contribute additively to stabilization of the EGFR dimer. EMBO J. 1997;16:281–294. doi:10.1093/emboj/16.2.281. - DOI - PMC - PubMed
    1. Linggi B, Carpenter G. ErbB receptors: new insights on mechanisms and biology. Trends Cell Biol. 2006;16:649–656. doi:10.1016/j.tcb.2006.10.008. - DOI - PubMed
    1. Nicholson RI, Gee JM, Harper ME. EGFR and cancer prognosis. Eur J Cancer. 2001;37(Suppl 4):9. doi:10.1016/S0959-8049(01)00231-3. - DOI - PubMed
    1. Dittmann K, Mayer C, Fehrenbacher B, Schaller M, Kehlbach R, Rodemann HP. Nuclear EGFR shuttling induced by ionizing radiation is regulated by phosphorylation at residue Thr654. FEBS Lett. 2010;584:3878–3884. doi:10.1016/j.febslet.2010.08.005. - DOI - PubMed
    1. Schmidt-Ullrich RK, Mikkelsen RB, Dent P, Todd DG, Valerie K, Kavanagh BD, Contessa JN, Rorrer WK, Chen PB. Radiation-induced proliferation of the human A431 squamous carcinoma cells is dependent on EGFR tyrosine phosphorylation. Oncogene. 1997;15:1191–1197. doi:10.1038/sj.onc.1201275. - DOI - PubMed

Publication types

MeSH terms