Review
. 2018 Jan 29;13(1):e0191124.
doi: 10.1371/journal.pone.0191124. eCollection 2018.

The differential impact of scientific quality, bibliometric factors, and social media activity on the influence of systematic reviews and meta-analyses about psoriasis

Affiliations
Review

The differential impact of scientific quality, bibliometric factors, and social media activity on the influence of systematic reviews and meta-analyses about psoriasis

Juan Ruano et al. PLoS One. .

Abstract

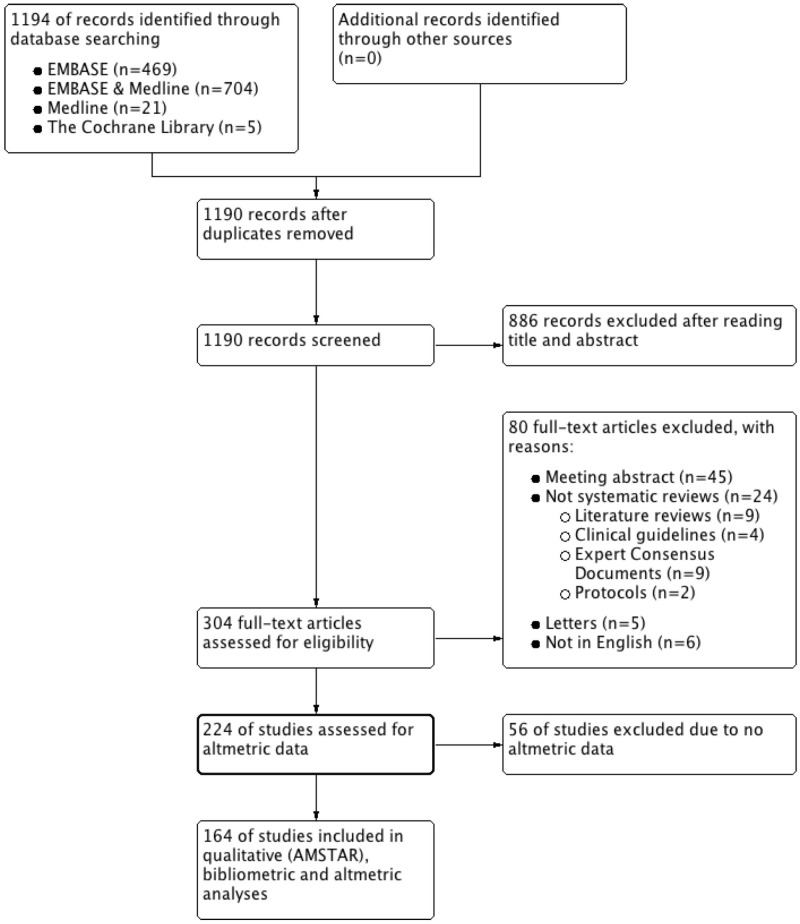
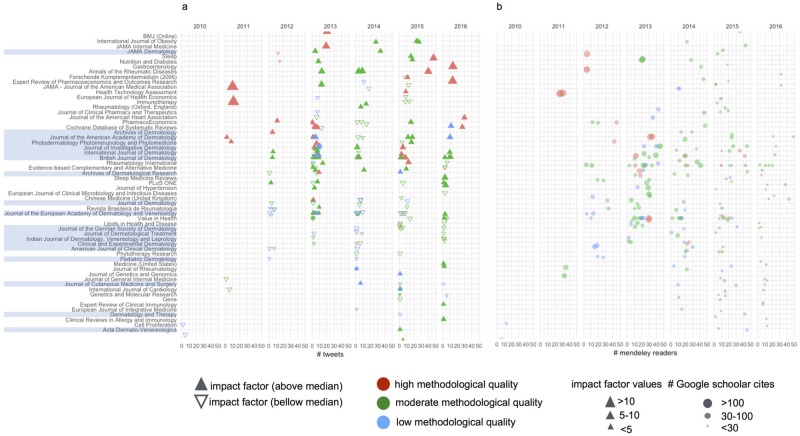
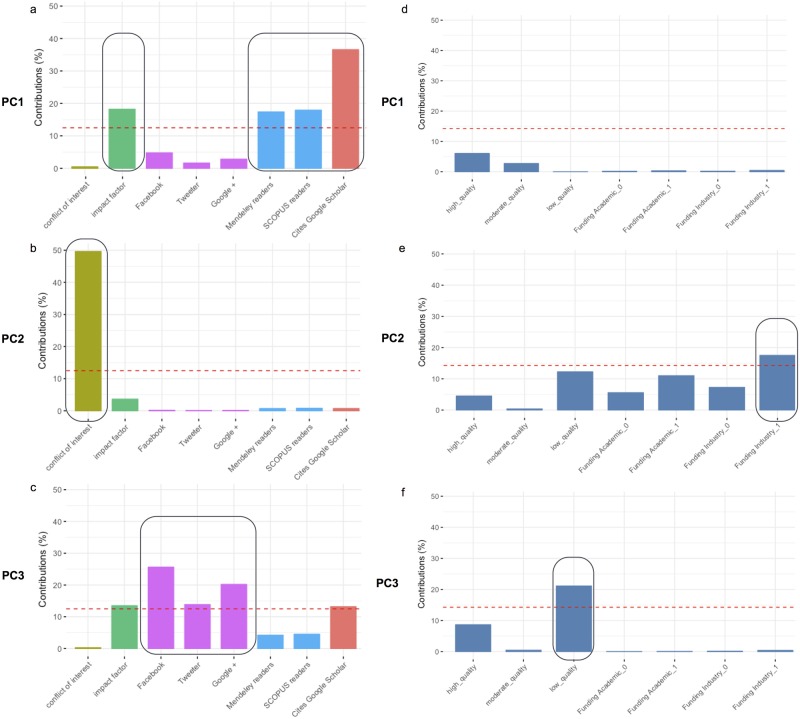
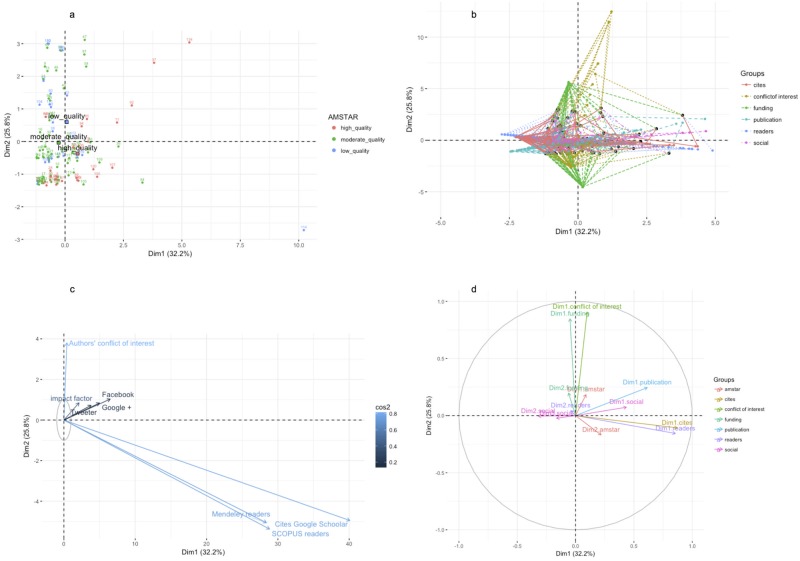
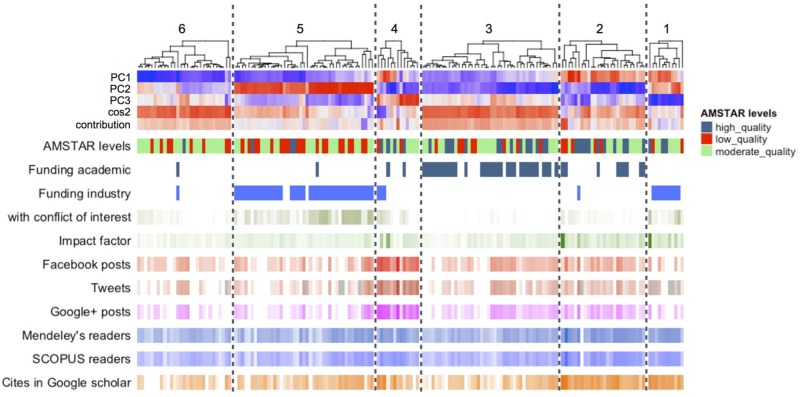
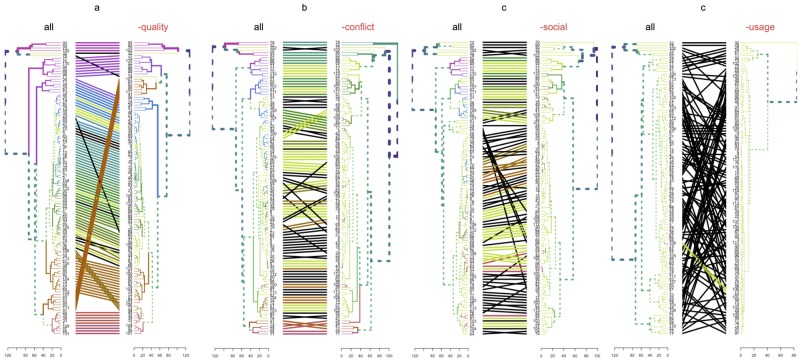
Researchers are increasingly using on line social networks to promote their work. Some authors have suggested that measuring social media activity can predict the impact of a primary study (i.e., whether or not an article will be highly cited). However, the influence of variables such as scientific quality, research disclosures, and journal characteristics on systematic reviews and meta-analyses has not yet been assessed. The present study aims to describe the effect of complex interactions between bibliometric factors and social media activity on the impact of systematic reviews and meta-analyses about psoriasis (PROSPERO 2016: CRD42016053181). Methodological quality was assessed using the Assessing the Methodological Quality of Systematic Reviews (AMSTAR) tool. Altmetrics, which consider Twitter, Facebook, and Google+ mention counts as well as Mendeley and SCOPUS readers, and corresponding article citation counts from Google Scholar were obtained for each article. Metadata and journal-related bibliometric indices were also obtained. One-hundred and sixty-four reviews with available altmetrics information were included in the final multifactorial analysis, which showed that social media and impact factor have less effect than Mendeley and SCOPUS readers on the number of cites that appear in Google Scholar. Although a journal's impact factor predicted the number of tweets (OR, 1.202; 95% CI, 1.087-1.049), the years of publication and the number of Mendeley readers predicted the number of citations in Google Scholar (OR, 1.033; 95% CI, 1.018-1.329). Finally, methodological quality was related neither with bibliometric influence nor social media activity for systematic reviews. In conclusion, there seems to be a lack of connectivity between scientific quality, social media activity, and article usage, thus predicting scientific success based on these variables may be inappropriate in the particular case of systematic reviews.


Conflict of interest statement

Competing Interests: JR has received honoraria for lecturing and grants for research from Pfizer, honoraria for lecturing from Janssen-Cilag and Novartis, and other financial benefits from AbbVie and Novartis; FG-G has received honoraria for research from Pfizer, and for lecturing from AbbVie, Janssen-Cilag and Novartis; AVG-N has received honoraria for lecturing from Pfizer, Novartis, AbbVie, and Janssen-Cilag, and other financial benefits from AbbVie, Novartis, and Janssen-Cilag. MA-L, PA-M, JG-M, PJC-F, BM-L, JLS-C, JLH-R, MG-P, and BI-T have no disclosures. This does not alter our adherence to PLOS ONE policies on sharing data and materials.

Figures

Fig 1
Fig 1. PRISMA flow diagram of article selection process.
Fig 2
Fig 2. Bibliometric and altmetric features of systematic reviews and meta-analysis on psoriasis.
Journals were sorted based on median Twitter mention counts considering all published articles in the same journal. Reviews are represented by colored figures based on AMSTAR levels. (a) Articles are displayed based on journal, year of publication, and Twitter mention counts. Triangles that represent reviews are colored based on their methodological quality (AMSTAR level). Up- and down- triangles represent reviews published in journals whose impact factor is above or bellow the median of journal in our dataset, respectively. Triangle size is proportional to the value of journal’s impact factor. (b) Articles are represented by circles and displayed based on journal, year of publication, and number of readers on Mendeley. Circle size is proportional to Google scholar cites.
Fig 3
Fig 3. Contribution of quantitative and qualitative variables to principal components.
This panel of six plots display the percentage of contribution to components PC1 (a-d), PC2 (b-e), and PC3 (c-f) by quantitative (a-c) and qualitative (d-f) variables.
Fig 4
Fig 4. Multiple factor analyses (MFA).
This panel display four plots PC1—PC2 scores of reviews (a), variables (c), and group of variables (b-d). Fig 3a: reviews are colored based on methodological quality (red: high; green: moderate; blue: low); Fig 3b and 3d: projections of reviews to variable position and coordinates of the partial axes by variable were colored by group; Fig 3c: A gradient scale of blues represent values of squared cosines associated with PC1-PC2 variable projections.
Fig 5
Fig 5. Scale reduction of SRs by multifactorial analysis (MFA).
Clustering heat map of all include reviews based on PC1, PC2, and PC3 projections, and the quality and contribution of these values per review. Six clusters (1-6) were indentified. Article- and journal-related bibliometric and altmetric metadata are also displayed as individual heat maps.
Fig 6
Fig 6. Influence of variable groups on multifactorial-based by clustering dendrogram comparisons.
This panel of four plots compare dendrograms with the same set of labels, one facing the other, and having their labels connected by lines. In every comparison, all-variables clustering dendrogram was compared with a modified version of this dendrogram obtained after subtracting one of these group of variables at a time (a, ‘quality’: AMSTAR levels; b, ‘conflict’: source of funding, number of authors with conflict of interest; c, ‘social’: Twitter, Facebook, and Google+ mention counts; d, ‘usage’: Mendeley and SCOPUS readers and citation counts from Google Scholar). Unique nodes are highlighted with dashed lines. Connecting lines are colored to highlight two sub-trees which are present in both dendrograms. Black lines connect nodes not included in the same sub-tree. Same color of trees branches show two common sub-trees.

References

    1. Van Noorden R. Online collaboration: Scientists and the social network. Nature 2014;512:126–9. doi: 10.1038/512126a - DOI - PubMed
    1. Ioannidis JP. The Mass Production of Redundant, Misleading, and Conflicted Systematic Reviews and Meta-analyses. Milbank Q. 2016. September;94(3):485–514. doi: 10.1111/1468-0009.12210 - DOI - PMC - PubMed
    1. Winter JCF. The relationship between tweets, citations, and article views for PLOS ONE articles. Scientometrics 2015;102:1773–9. doi: 10.1007/s11192-014-1445-x - DOI
    1. Eysenbach G. Can tweets predict citations? Metrics of social impact based on Twitter and correlation with traditional metrics of scientific impact. J Med Internet Res 2012;3:e123. - PMC - PubMed
    1. Haustein S, Peters I, Sugimoto CR, et al. Tweeting biomedicine: An analysis of tweets and citations in the biomedical literature. J Assn Inf Sci Tec 2014;65:656–669. doi: 10.1002/asi.23101 - DOI