. 2018 Jan 29;13(1):e0190574.
doi: 10.1371/journal.pone.0190574. eCollection 2018.

A parsimonious characterization of change in global age-specific and total fertility rates

Affiliations

A parsimonious characterization of change in global age-specific and total fertility rates

Athena Pantazis et al. PLoS One. .

Abstract

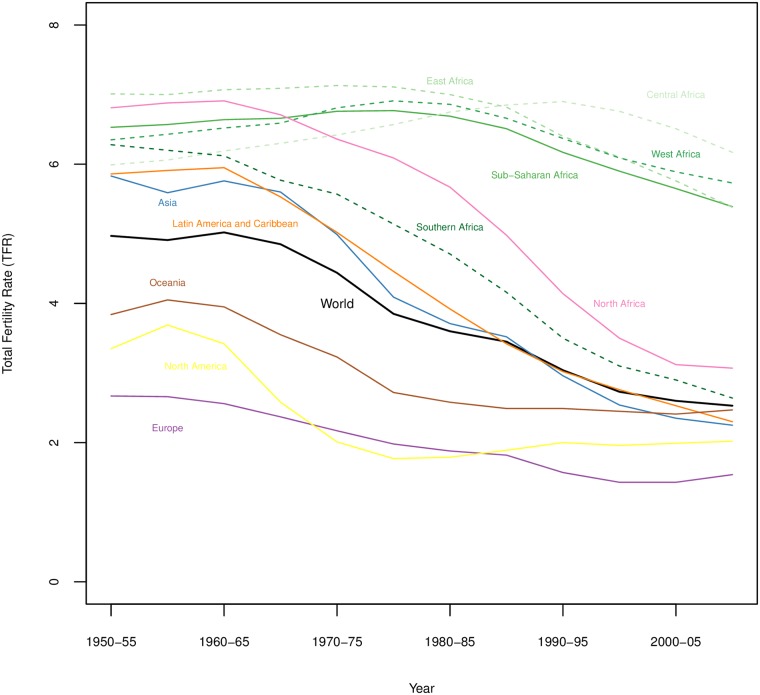
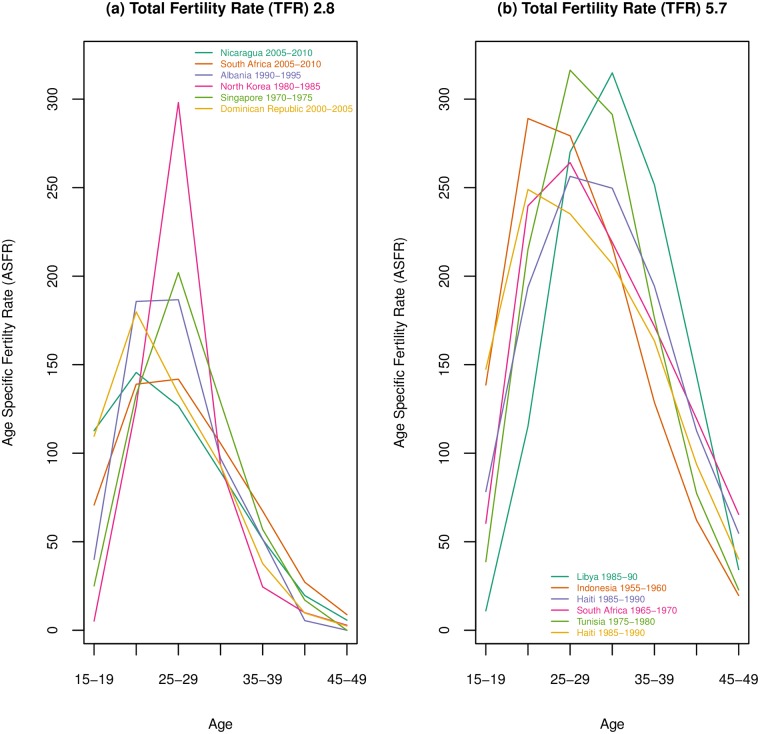
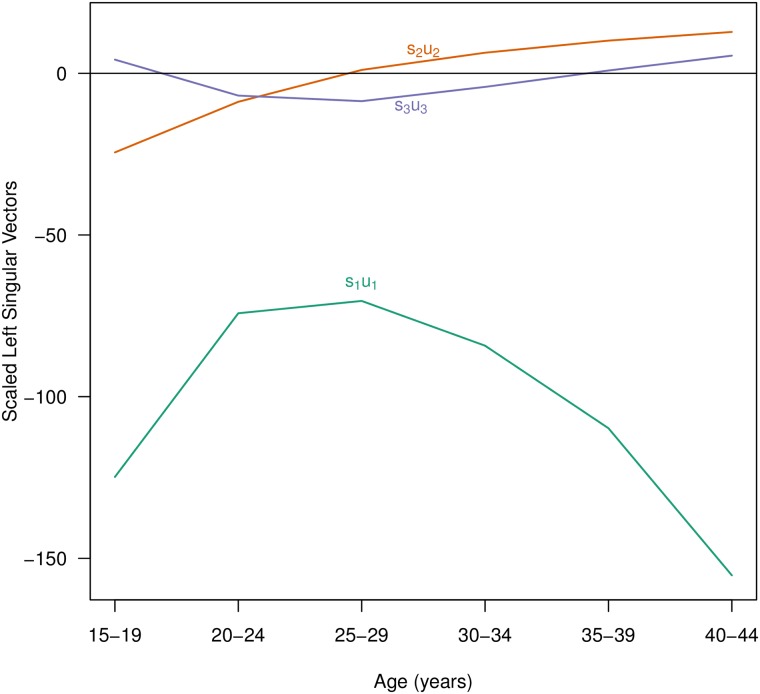
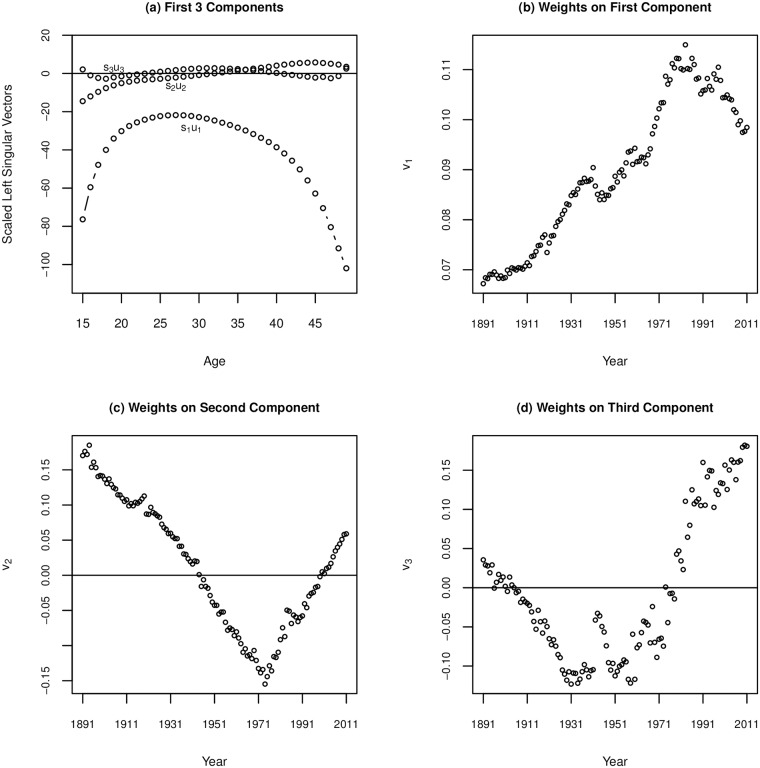
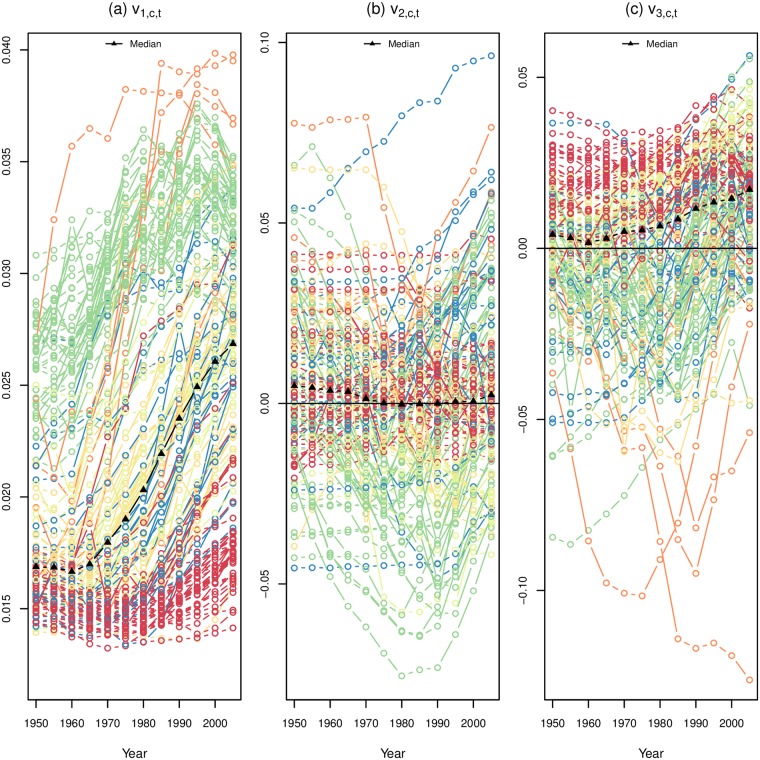
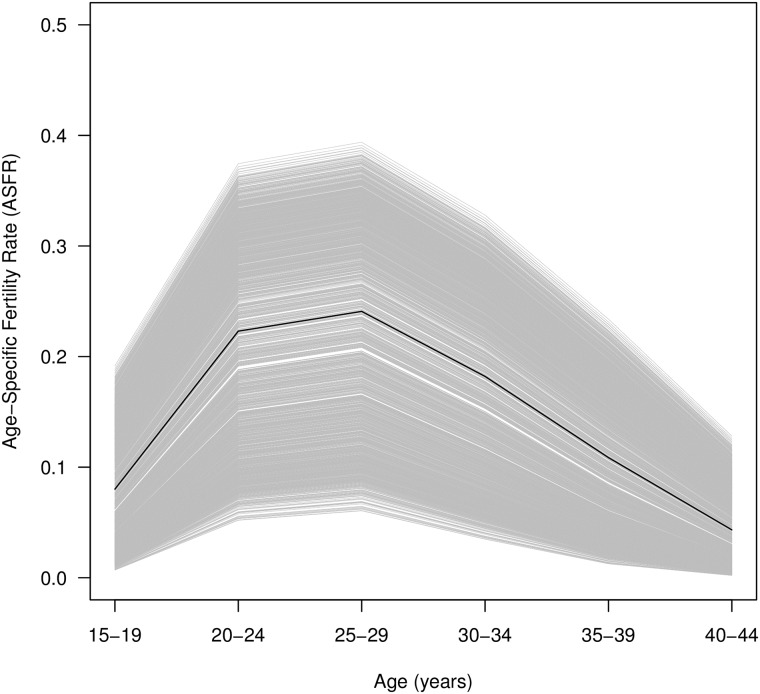
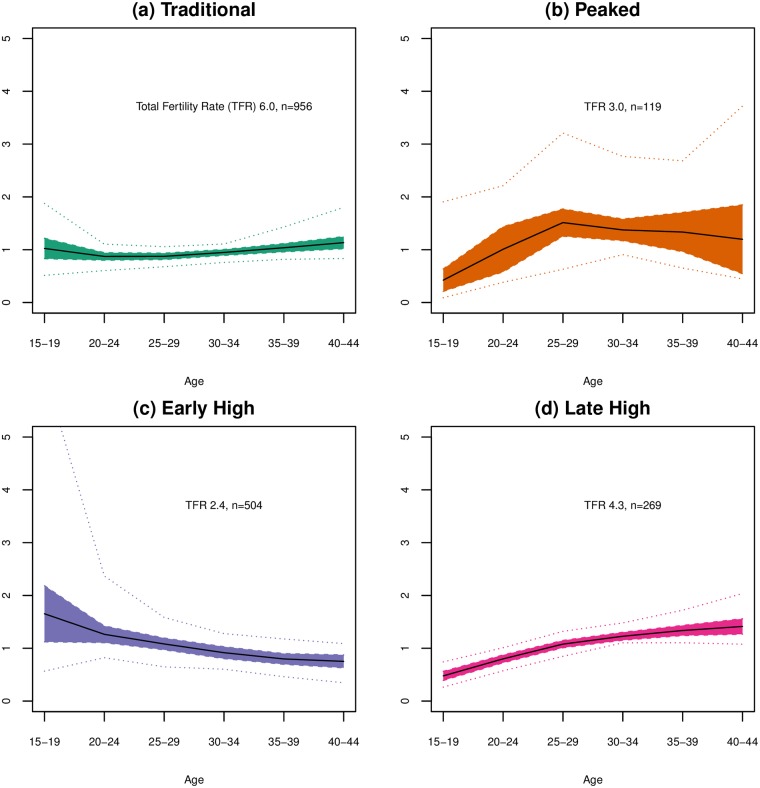
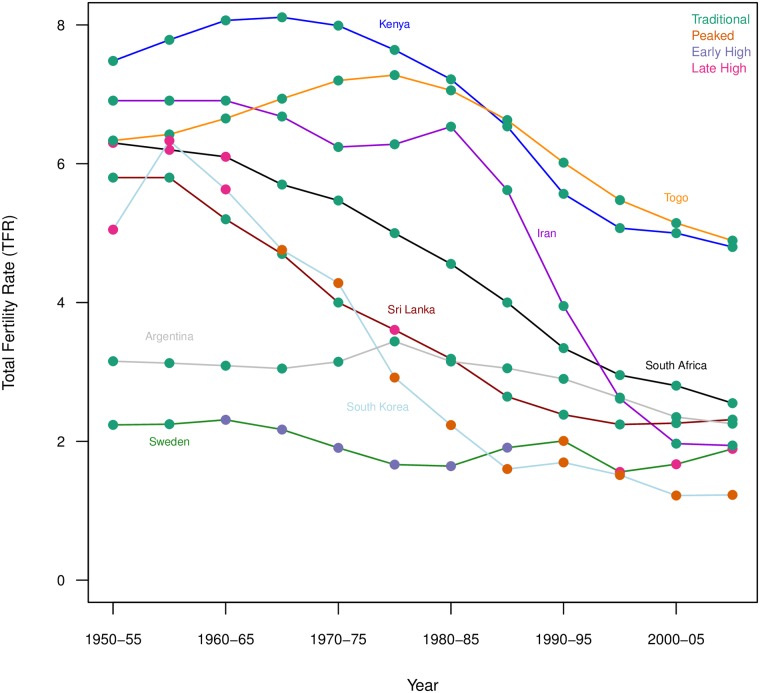
This study aims to understand trends in global fertility from 1950-2010 though the analysis of age-specific fertility rates. This approach incorporates both the overall level, as when the total fertility rate is modeled, and different patterns of age-specific fertility to examine the relationship between changes in age-specific fertility and fertility decline. Singular value decomposition is used to capture the variation in age-specific fertility curves while reducing the number of dimensions, allowing curves to be described nearly fully with three parameters. Regional patterns and trends over time are evident in parameter values, suggesting this method provides a useful tool for considering fertility decline globally. The second and third parameters were analyzed using model-based clustering to examine patterns of age-specific fertility over time and place; four clusters were obtained. A country's demographic transition can be traced through time by membership in the different clusters, and regional patterns in the trajectories through time and with fertility decline are identified.


Conflict of interest statement

Competing Interests: The authors have declared that no competing interests exist.

Figures

Fig 1
Fig 1. Trends in TFR by world region, with sub-regions for sub-Saharan Africa.
Data from UN World Population Prospects [6].
Fig 2
Fig 2. Example age-specific fertility curves producing the same total fertility rate.
The first panel shows a selection of age-specific fertility curves that create a total fertility rate of 2.8; the second panel shows different curves that sum to a total fertility rate of 5.7. Data from UN World Population Prospects [6].
Fig 3
Fig 3. First three components (scaled left singular vectors) from SVD factorization of age-specific fertility schedules.
Data from the UN WPP [6] for 154 countries in five year intervals from 1950-55 to 2005-10 for five year age groups.
Fig 4
Fig 4. Total fertility rate for Sweden from 1891 to 2011.
Data from the Human Fertility Collection [20].
Fig 5
Fig 5. SVD results for Swedish ASFR 1891-2011.
(a) Scaled left singular vectors, showing the first 3 of 35 components from the SVD; (b) Weights (v1) associated with the first component (s1u1); (c)Weights (v2) associated with the second component (s2u2); (d) Weights (v3) associated with the third component (s3u3).
Fig 6
Fig 6. Weights on each component by country from 1950-55 through 2005-2010.
(a) Shows the first component weights, v1ct; (b) shows the second component weights, v2ct; and (c) shows the third component weights, v3ct. Colors indicate world region: red for sub-Saharan Africa, orange for East Asia, yellow for South Asia, light green for Latin America and the Caribbean, green for the West, and blue for the Middle East and North Africa.
Fig 7
Fig 7. Age-specific fertility curve reconstructed from first component only.
Median age-specific fertility curve constructed from the first SVD component only shown in black. All curves constructed for each county and time period shown in gray.
Fig 8
Fig 8. Changes to general age-specific fertility curve by cluster.
Median exponentiated reconstructed curve is shown with interquartile range shaded and dotted lines showing extrema values for combined changes to the base age-specific fertility curve by including weighted components 2 and 3 for each of the 4 clusters: (a) the Traditional Curve cluster; (b) Peaked cluster; (c) Early High cluster; and (d) Late High cluster. These curves show the cluster characteristic deviations from the first component curve; values of 1 represent no change to the base curve.
Fig 9
Fig 9. Trends in total fertility rates with cluster assignments for select countries.

References

    1. United Nations, Department of Economic and Social Affairs, Population Division. World Population Prospects: the 2015 Revision, Key Findings and Advance Tables; 2015.
    1. Bongaarts J, Casterline J. Fertility Transition: Is sub-Saharan Africa Different? Population and development review. 2013;38:153–168. doi: 10.1111/j.1728-4457.2013.00557.x - DOI - PMC - PubMed
    1. Caldwell JC, Orubuloye IO, Caldwell P. Fertility Decline in Africa: A New Type of Transition? Population and development review. 1992;18(2):211–242. doi: 10.2307/1973678 - DOI
    1. Machiyama K. A re-examination of recent fertility declines in sub-Saharan Africa. MEASURE DHS; 2010. 68.
    1. Dorius SF. Global Demographic Convergence? A Reconsideration of Changing Intercountry Inequality in Fertility. Population and development review. 2008;34(3):519–537. doi: 10.1111/j.1728-4457.2008.00235.x - DOI

LinkOut - more resources