. 2018 Jan 29;14(1):e1006824.
doi: 10.1371/journal.ppat.1006824. eCollection 2018 Jan.

Global synonymous mutagenesis identifies cis-acting RNA elements that regulate HIV-1 splicing and replication

Affiliations

Global synonymous mutagenesis identifies cis-acting RNA elements that regulate HIV-1 splicing and replication

Matthew A Takata et al. PLoS Pathog. .

Abstract

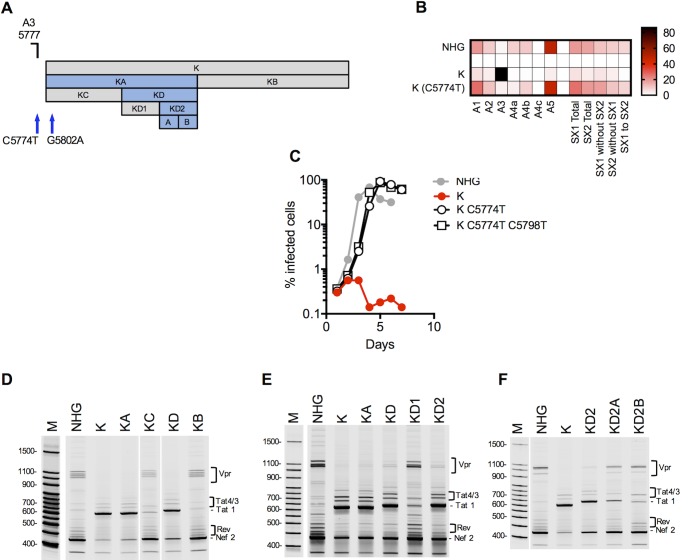
The ~9.5 kilobase HIV-1 genome contains RNA sequences and structures that control many aspects of viral replication, including transcription, splicing, nuclear export, translation, packaging and reverse transcription. Nonetheless, chemical probing and other approaches suggest that the HIV-1 genome may contain many more RNA secondary structures of unknown importance and function. To determine whether there are additional, undiscovered cis-acting RNA elements in the HIV-1 genome that are important for viral replication, we undertook a global silent mutagenesis experiment. Sixteen mutant proviruses containing clusters of ~50 to ~200 synonymous mutations covering nearly the entire HIV-1 protein coding sequence were designed and synthesized. Analyses of these mutant viruses resulted in their division into three phenotypic groups. Group 1 mutants exhibited near wild-type replication, Group 2 mutants exhibited replication defects accompanied by perturbed RNA splicing, and Group 3 mutants had replication defects in the absence of obvious splicing perturbation. The three phenotypes were caused by mutations that exhibited a clear regional bias in their distribution along the viral genome, and those that caused replication defects all caused reductions in the level of unspliced RNA. We characterized in detail the underlying defects for Group 2 mutants. Second-site revertants that enabled viral replication could be derived for Group 2 mutants, and generally contained point mutations that reduced the utilization of proximal splice sites. Mapping of the changes responsible for splicing perturbations in Group 2 viruses revealed the presence of several RNA sequences that apparently suppressed the use of cryptic or canonical splice sites. Some sequences that affected splicing were diffusely distributed, while others could be mapped to discrete elements, proximal or distal to the affected splice site(s). Overall, our data indicate complex negative regulation of HIV-1 splicing by RNA elements in various regions of the HIV-1 genome that enable balanced splicing and viral replication.


Conflict of interest statement

The authors have declared that no competing interests exist

Figures

Fig 1
Fig 1. Design and analysis of panel of synonymously mutated HIV-1 viruses.
(A) Schematic of HIV-1 proviral DNA, indicating open reading frames, splice sites, and blocks of nucleotides that were synonymously mutated in the 16 proviral plasmids (A-P). (B) Single-cycle infectious titers (measured using MT4 cells) 48h following transfection of 293T cells with each of the WT(HIV-1NHG) and mutant (A-P) proviral plasmids. Valuses are given as mean±sd. (n = 3) *p<0.05, **p<0.005 by students t-test, calculated with relative values normalized to WT values in each experiment. (C) Western blot analysis of protein levels in transfected cells (and virion particles where indicated) at 48h after transfection of 293T cells with each of the WT(HIV-1NHG) and mutant (A-P) proviral plasmids.
Fig 2
Fig 2. Spreading replication properties of mutant viruses.
(A-P) MT4 cells were infected with the indicated virus (harvested from the supernatant of 293T cells transfected with each of the WT(HIV-1NHG) or mutant (A-P) proviral plasmids at an MOI of 0.002. Aliquots of infected cells were withdrawn each day, fixed in 4% PFA and the proportion of infected cells determined by FACS analysis of GFP expression. a Representative replication curve for WT(HIV-1NHG) is plotted in each chart as grey symbols and line, while each mutant is plotted using red symbols and lines.
Fig 3
Fig 3. Analysis of HIV-1 splicing in WT and synonymously mutated HIV-1.
(A) Schematic representation of segments of HIV-1 proviral DNA, focused on mutants exhibiting perturbed splicing. Canonical splice sites (black) and cryptic splice sites (red) are indicated, as are blocks of nucleotides that were synonymously mutated in the viruses exhibiting perturbed splicing. (B-E) Nextgen sequencing analysis of HIV-1 splicing, heatmaps indicate relative proportion of sequencing reads that indicate splicing at the sites indicated at the bottom of the heatmaps (B, C), or inclusion of the short exons (SX1 and/or SX2) indicated at the bottom of the heatmap (D). For panel (C) only direct splicing to the indicated acceptor sites is indicated in the heatmap. Alternatively, the relative abundance of the various 1.8 kb mRNA species is indicated (E). (F) Fluorescent primer PCR analysis of HIV-1 splicing. 293T cells were transfected with the indicated proviruses, RNA extracted and cDNA synthesized. A sense PCR primer situated 5’ to the major splice donor, along with an antisense primer positioned either 3’ to A7 or 3’ to D4 (labelled with IRD800) were used to amplify cDNAs derived from the 1.8 kb (top) or 4 kb (bottom) classes of spliced HIV-1 mRNAs respectively. PCR products were subjected to PAGE and a LI-COR Odyssey scanner was used to detect fluorescent signals directly from the gels.
Fig 4
Fig 4. Phenotypes of synonymously mutated HIV-1 viruses.
(A) Summary of the properties of HIV-1 viruses carrying blocks of nucleotides that were synonymously mutated (A-P). The frequency of splice site utilization was assessed in transfected 293T cells (Fig 3), Single-cycle replication assays were used to assess unspliced RNA levels and infectious virus yield (see panels B and C below). Replication competence was determined using spreading replication assays (Fig 2 and S1 Fig). (B) Infectious virion yield measured in the supernatant of MT4 cells, infected with each of the mutant viruses at an MOI of 1.0, and harvested 2 days post infection. Values are the mean ±sd n = 3 or n = 2 experiments, *p<0.05, **p<0.005 by students t-test calculated with relative values compared to wildtype virus (*** Values were below the limit of quantitation). (C) Levels of unspliced HIV-1 genomes in RNA extracted from MT4 cells, infected with each of the mutant viruses at an MOI of 1.0, and harvested 2 days post infection, mean ±sd n = 3 or n = 2 experiments, *p<0.05 by students t-test compared to wildtype virus. (*** Values were below the limit of quantitation).
Fig 5
Fig 5. Activation of cryptic splice sites by synonymous mutations in Gag.
(A, B) MT4 cells were infected with the indicated virus (harvested from the supernatant of 293T cells transfected proviral plasmids representing each of the WT(HIV-1NHG), mutant (A, B and revertants (A C819T, A1130G and B T1311C, G1326A) thereof) at an MOI of 0.002. Aliquots of infected cells were withdrawn each day and the proportion of infected cells determined by FACS analysis of GFP expression. (C) Next gen sequencing analysis of HIV-1 splicing. The heatmap indicates relative proportion of sequencing reads that used the cryptic splice sites for WT(HIV-1NHG), mutant (A, B and revertants thereof). (D,E) Schematic representation of the mutant blocks of nucleotides in HIV-1 mutants A (D) and B (F), indicating positions of mutant derivatives (AA, AB, BA, BB) etc, and the positions of cryptic splice sites and revertant mutant sites. Blocks colored blue are those that conferred overt splicing perturbations when mutated. (F) Fluorescent primer PCR analysis of HIV-1 splicing in mutant A. A sense PCR primer situated 5’ to the cryptic donor D1169, was used along with an antisense primer positioned 3’ to A7 (labelled with IRD800) was used to amplify cDNAs derived from the 1.8 kb class of spliced HIV-1 mRNAs respectively. (G) Fluorescent primer PCR analysis of HIV-1 splicing in mutant B. A sense PCR primer situated 5’ to D1, was used along with an antisense primer positioned 3’ to the mutant B block (labelled with IRD800) was used to amplify cDNAs derived HIV-1 mRNAs. For panels (F) and (G) PCR products were subjected to PAGE and a LI-COR Odyssey scanner was used to detect fluorescent signals directly from the gels.
Fig 6
Fig 6. Activation of canonical splice acceptor sites (A1 and A2) by synonymous mutations in mutant I.
(A) Schematic representation of the mutant blocks of nucleotides in HIV-1 mutant I, indicating positions of mutant derivatives (IA, IB, IC….etc), and the positions of splice sites and revertant mutant sites (blue arrows). Blocks colored blue are those that conferred overt splicing perturbations when mutated. (B) Next gen sequencing analysis of HIV-1 splicing in transfected 293T cells. The heatmap indicates relative proportion of sequencing reads that indicate direct splicing to the indicated acceptors or inclusion of the short exons (SX1 and/or SX2) as indicated at the bottom of the heatmap for WT(HIV-1NHG), mutants I, IA, IB and revertants thereof. (C, D) MT4 cells were infected with the indicated virus (harvested from the supernatant of 293T cells transfected proviral plasmids representing WT(HIV-1NHG), mutant (I, IA, IB and revertants thereof) at an MOI of 0.002. Aliquots of infected cells were withdrawn each day and the proportion of infected cells determined by FACS analysis of GFP expression. (E, F) Fluorescent primer PCR analysis of HIV-1 splicing. 293T cells were transfected with the indicated WT and mutant proviruses, RNA extracted and cDNA synthesized. A sense PCR primer situated 5’ to the major splice donor, was used along with an antisense primer positioned 3’ to A7 (labelled with IRD800) to amplify cDNAs derived from the 1.8 kb class of spliced HIV-1 mRNAs. PCR products were subjected to PAGE and a LI-COR Odyssey scanner was used to detect fluorescent signals directly from the gels. Salient mRNA species determined by direct sequencing of extracted gel bands, or inferred from Nextgen sequencing assays are indicated.
Fig 7
Fig 7. Activation of canonical splice acceptor site A2 by synonymous mutations in mutant J.
(A) Schematic representation of the mutant blocks of nucleotides in HIV-1 mutant J, indicating positions of mutant derivatives (JA, JB, JC….etc), and the positions of splice sites and revertant mutant sites (blue arrows). Blocks colored blue are those that conferred overt splicing perturbations when mutated. (B) Next gen sequencing analysis of HIV-1 splicing in transfected 293T cells. The heatmap indicates relative proportion of sequencing reads that indicate direct splicing to the acceptors or inclusion of the short exons (SX1 and/or SX2) indicated at the bottom of the heatmap for WT(HIV-1NHG), mutants J, JA, JB and revertants thereof. (C, D) MT4 cells were infected with the indicated virus (harvested from the supernatant of 293T cells transfected proviral plasmids representing each of the WT(HIV-1NHG), mutant or revertant viruses at an MOI of 0.002. Aliquots of infected cells were withdrawn each day and the proportion of infected cells determined by FACS analysis of GFP expression. (E, F) Fluorescent primer PCR analysis of HIV-1 splicing. 293T cells were transfected with the indicated WT (HIV-1NHG) and mutant proviruses, RNA extracted and cDNA synthesized. A sense PCR primer situated 5’ to the major splice donor, was used along with an antisense primer positioned 3’ to A7 (labeled with IRD800) to amplify cDNAs derived from the 1.8 kb class of spliced HIV-1 mRNAs. PCR products were subjected to PAGE and a LI-COR Odyssey scanner was used to detect fluorescent signals directly from the gels. Salient mRNA species determined by direct sequencing of extracted gel bands, or inferred from Nextgen sequencing assays are indicated.
Fig 8
Fig 8. Activation of canonical splice acceptor site A3 by synonymous mutations in mutant K.
(A) Schematic representation of the mutant blocks of nucleotides in HIV-1 mutant K, indicating positions of mutant derivatives (KA, KB, KC….etc), and the positions of splice sites and revertant mutant sites (blue arrows). Blocks colored blue are those that conferred overt splicing perturbations when mutated. (B) Next gen sequencing analysis of HIV-1 splicing in transfected 293T cells. The heatmap indicates relative proportion of sequencing reads that indicate direct splicing to the acceptors or inclusion of the short exons (SX1 and/or SX2) indicated at the bottom of the heatmap for WT(HIV-1NHG), mutant K and the C5774T revertant. (C) MT4 cells were infected with the indicated virus (harvested from the supernatant of 293T cells transfected proviral plasmids representing each of the WT(HIV-1NHG), mutant or revertant viruses at an MOI of 0.002. Aliquots of infected cells were withdrawn each day and the proportion of infected cells determined by FACS analysis of GFP expression. (D, E, F) Fluorescent primer PCR analysis of HIV-1 splicing. 293T cells were transfected with the indicated WT (HIV-1NHG) and mutant proviruses, RNA extracted and cDNA synthesized. A sense PCR primer situated 5’ to the major splice donor, was used along with an antisense primer positioned 3’ to A7 (labeled with IRD800) to amplify cDNAs derived from the 1.8 kb class of spliced HIV-1 mRNAs. PCR products were subjected to PAGE and a LI-COR Odyssey scanner was used to detect fluorescent signals directly from the gels. Salient mRNA species determined by direct sequencing of extracted gel bands, or inferred from Nextgen sequencing assays are indicated.
Fig 9
Fig 9. Summary of splicing control in HIV-1.
(A) Schematic representation of the central portion of the HIV-1 genome with the positions of canonical splice sites indicated. Previously identified splicing control elements are indicated with grey lines. Sequences identified in this study whose mutation enhanced splicing are indicated with red lines and the splice acceptors on which they act are indicated with red arrows. (B) The sequences of the identified elements that affect splicing (upper line = WT sequence, lower line = oversplicing mutant sequence) are shown.

References

    1. Frankel AD, Young JA. HIV-1: fifteen proteins and an RNA. Annu Rev Biochem. 1998;67:1–25. doi: 10.1146/annurev.biochem.67.1.1 . - DOI - PubMed
    1. Cullen BR. RNA-sequence-mediated gene regulation in HIV-1. Infect Agents Dis. 1994;3(2–3):68–76. . - PubMed
    1. Purcell DF, Martin MA. Alternative splicing of human immunodeficiency virus type 1 mRNA modulates viral protein expression, replication, and infectivity. J Virol. 1993;67(11):6365–78. ; PubMed Central PMCID: PMCPMC238071. - PMC - PubMed
    1. Stoltzfus CM, Madsen JM. Role of viral splicing elements and cellular RNA binding proteins in regulation of HIV-1 alternative RNA splicing. Curr HIV Res. 2006;4(1):43–55. . - PubMed
    1. Malim MH, Tiley LS, McCarn DF, Rusche JR, Hauber J, Cullen BR. HIV-1 structural gene expression requires binding of the Rev trans-activator to its RNA target sequence. Cell. 1990;60(4):675–83. . - PubMed

Publication types

LinkOut - more resources