. 2019 Mar 1;29(3):994-1005.
doi: 10.1093/cercor/bhy006.

Subthreshold Activity Underlying the Diversity and Selectivity of the Primary Auditory Cortex Studied by Intracellular Recordings in Awake Marmosets

Affiliations

Subthreshold Activity Underlying the Diversity and Selectivity of the Primary Auditory Cortex Studied by Intracellular Recordings in Awake Marmosets

Lixia Gao et al. Cereb Cortex. .

Abstract

Extracellular recording studies have revealed diverse and selective neural responses in the primary auditory cortex (A1) of awake animals. However, we have limited knowledge on subthreshold events that give rise to these responses, especially in non-human primates, as intracellular recordings in awake animals pose substantial technical challenges. We developed a novel intracellular recording technique in awake marmosets to systematically study subthreshold activity of A1 neurons that underlies their diverse and selective spiking responses. Our findings showed that in contrast to predominantly transient depolarization observed in A1 of anesthetized animals, both transient and sustained depolarization (during or beyond the stimulus period) were observed. Comparing with spiking responses, subthreshold responses were often longer lasting in duration and more broadly tuned in frequency, and showed narrower intensity tuning in non-monotonic neurons and lower response threshold in monotonic neurons. These observations demonstrated the enhancement of stimulus selectivity from subthreshold to spiking responses in individual A1 neurons. Furthermore, A1 neurons classified as regular- or fast-spiking subpopulation based on their spike shapes exhibited distinct response properties in frequency and intensity domains. These findings provide valuable insights into cortical integration and transformation of auditory information at the cellular level in auditory cortex of awake non-human primates.


Figures

Figure 1.
Figure 1.
Frequency tuning properties of A1 neurons in awake state. A, B, C, Examples of subthreshold and spiking responses elicited by pure tones from three representative A1 neurons (M80Z0114, M22W0656, M14U1076). The spike width is 0.71, 0.25, and 0.71 ms, respectively. Left, mean subthreshold responses of 5 repetitions at each frequency. Right, raster plots of corresponding spiking responses. Gray shaded area indicates the duration of pure tone stimuli. Arrows points to the response to BFs of these 3 neurons. D, E, F, Frequency tuning curves measured by subthreshold response magnitude (left) and firing rate (right), respectively, averaged over the duration of the pure tone stimuli across 5 trials for the three example neurons shown in AC. Error bars and the gray area represent standard deviation. Dashed horizontal lines indicate mean spontaneous subthreshold response (left) or mean spontaneous firing rate (right) of each neuron. Asterisks indicate evoked responses that are significantly different from spontaneous responses. G, H, I, Example intracellular recording traces showing responses to BF tones for the three example neurons shown in AC, respectively. Gray shaded area indicates the duration of pure tone stimuli.
Figure 2.
Figure 2.
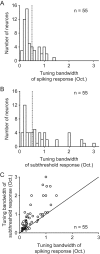
Tuning bandwidth of subthreshold and spiking responses in A1 neurons. A, B, Distributions of tuning bandwidths of spiking (A) and subthreshold (B) responses for all A1 neurons (n = 55). Vertical dashed line marks bandwidth of 0.5 octaves. Bin of width is 0.1 octaves. C, Tuning bandwidth of subthreshold response is plotted against that of spiking response for the same population of neurons as shown in A and B.
Figure 3.
Figure 3.
Rate-level functions of subthreshold and spiking responses of A1 neurons. A, Subthreshold (left) and spiking (right) responses of a representative A1 neuron (M22W1828) with monotonic rate-level function in response to BF tone with varying sound level. The spike width is 0.69 ms. Gray shaded area indicates the time periods of pure tone stimuli. B, C, Subthreshold (left) and spiking (right) responses of 2 representative A1 neurons (M22W0295, M22W0259) with non-monotonic rate-level functions. The spike width is 0.31 and 0.29 ms, respectively. D, E, F, Subthreshold response magnitude (left) and firing rate (right) averaged over the duration of the pure tone stimuli and across 5 trials plotted against the sound level, for the three example neurons shown in AC, respectively. Error bars and gray area show standard deviations. Dashed horizontal lines indicate mean spontaneous subthreshold response (left) and mean spontaneous firing rate (right) of each neuron. Asterisks indicate that evoked responses are significantly different from spontaneous responses. G, H, I, Example recording traces of response to BF tone at the loudest sound level tested for the three example neurons in AC, respectively. Gray shaded area indicates the duration of pure tone stimuli.
Figure 4.
Figure 4.
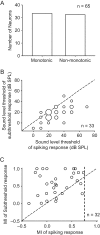
Quantitative analysis of monotonicity and sound level threshold. A, Distribution of neurons with monotonic or non-monotonic rate-level function. Neurons with the monotonicity index (MI) of firing rate (see Materials and Methods) greater than 0.75 were defined as neurons with monotonic rate-level function (n = 33), whereas neurons with the MI less than 0.75 were defined as neurons with non-monotonic rate-level function (n = 32). B, Sound level threshold of subthreshold response is plotted against that of spiking response for the neurons with monotonic rate-level function (n = 33). The size of circles is proportional to the number of neurons with the same threshold. C, MI of subthreshold response is plotted against that of spiking response for the neurons with non-monotonic rate-level function (n = 32). The vertical dashed line indicates MI of 0.75 in spiking response (see Materials and Methods).
Figure 5.
Figure 5.
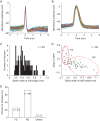
Classification of regular-spiking (RS) and fast-spiking (FS) neurons. A, B, Overlay of action potentials from 2 representative A1 neurons (M22W1522, M14U1076) with narrow (A) and broad (B) spike waveforms, respectively. C, Distribution of spike width (at half-amplitude, see Materials and Methods) of 89 A1 neurons with stable spike waveform. D, Slope of after-hyperpolarization-potential (AHP) (see Materials and Methods) is plotted against the spike width of 89 A1 neurons. The neurons are separated into RS and FS populations as indicated by 2 red ellipses. E, Number of classified RS and FS neurons. “Others” indicates neurons that were excluded from the 2 types.
Figure 6.
Figure 6.
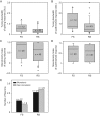
Comparison between FS and RS neurons. A, Tuning bandwidths of spiking response for FS (n = 12) and RS (n = 43) neurons. Boxes show 25th and 75th percentiles. The middle line inside the box represents the median and the whiskers indicate 95th and 5th percentiles. Data beyond the whiskers are displayed in dots. B, Tuning bandwidths of subthreshold response for FS (n = 12) and RS (n = 43) neurons. Format is the same as in A. CD, MI of spiking (C) and subthreshold response (D) for FS (n = 20) and RS (n = 45) neurons, respectively. Format is the same as in A. E, Number of monotonic and non-monotonic neurons in FS (n = 20) and RS (n = 45) subpopulations, respectively.

References

    1. Agamaite JA, Chang C-J, Osmanski MS, Wang X. 2015. A quantitative acoustic analysis of the vocal repertoire of the common marmoset (Callithrix jacchus). J Acoust Soc Am. 138:2906–2928. - PMC - PubMed
    1. Bartlett EL, Sadagopan S, Wang X. 2011. Fine frequency tuning in monkey auditory cortex and thalamus. J Neurophysiol. 106:849–859. - PMC - PubMed
    1. Bendor D, Wang X. 2007. Differential neural coding of acoustic flutter within primate auditory cortex. Nat Neurosci. 10:763–771. - PubMed
    1. Bendor D, Wang X. 2008. Neural response properties of primary, rostral, and rostrotemporal core fields in the auditory cortex of marmoset monkeys. J Neurophysiol. 100:888–906. - PMC - PubMed
    1. Bieser A, Muller-Preuss P. 1996. Auditory responsive cortex in the squirrel monkey: neural responses to amplitude-modulated sounds. Exp Brain Res. 108:273–284. - PubMed

Publication types