Case Reports
. 2018 Sep 15:473:166-177.
doi: 10.1016/j.mce.2018.01.016. Epub 2018 Feb 3.

Partial growth hormone insensitivity and dysregulatory immune disease associated with de novo germline activating STAT3 mutations

Affiliations
Case Reports

Partial growth hormone insensitivity and dysregulatory immune disease associated with de novo germline activating STAT3 mutations

Mariana Gutiérrez et al. Mol Cell Endocrinol. .

Abstract

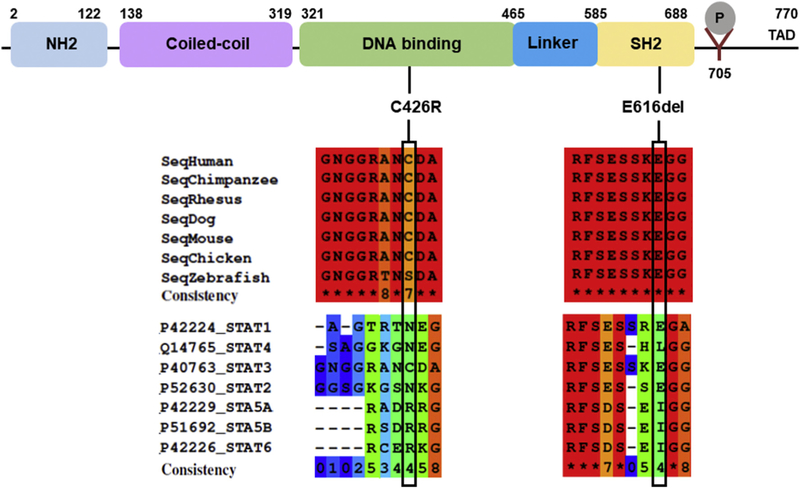
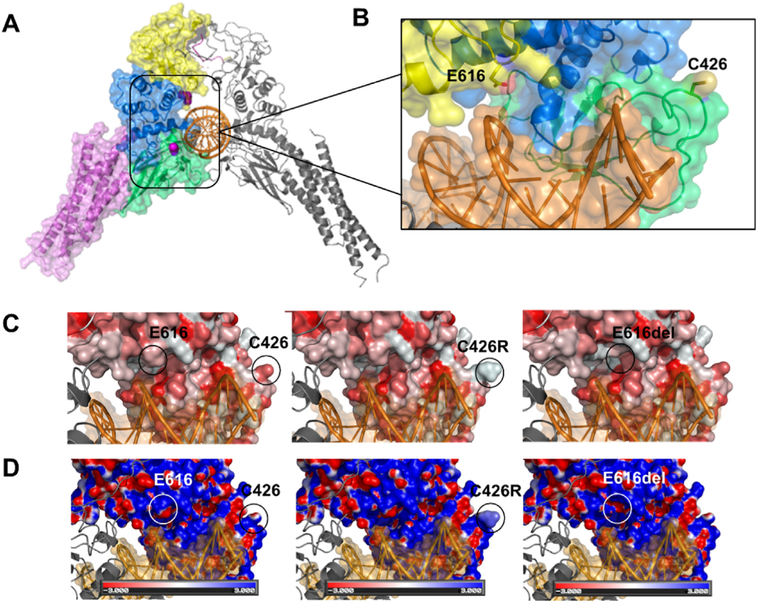
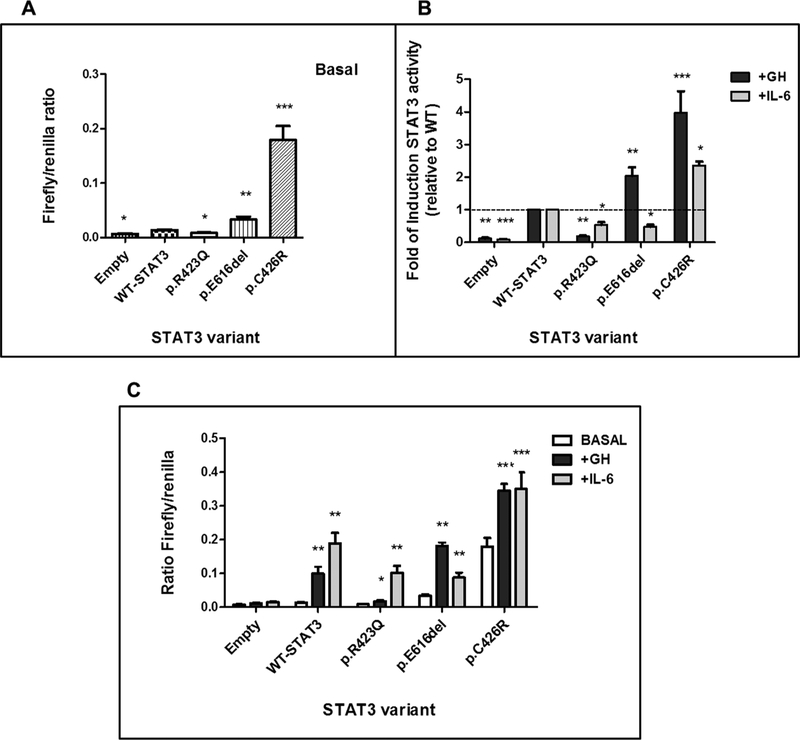
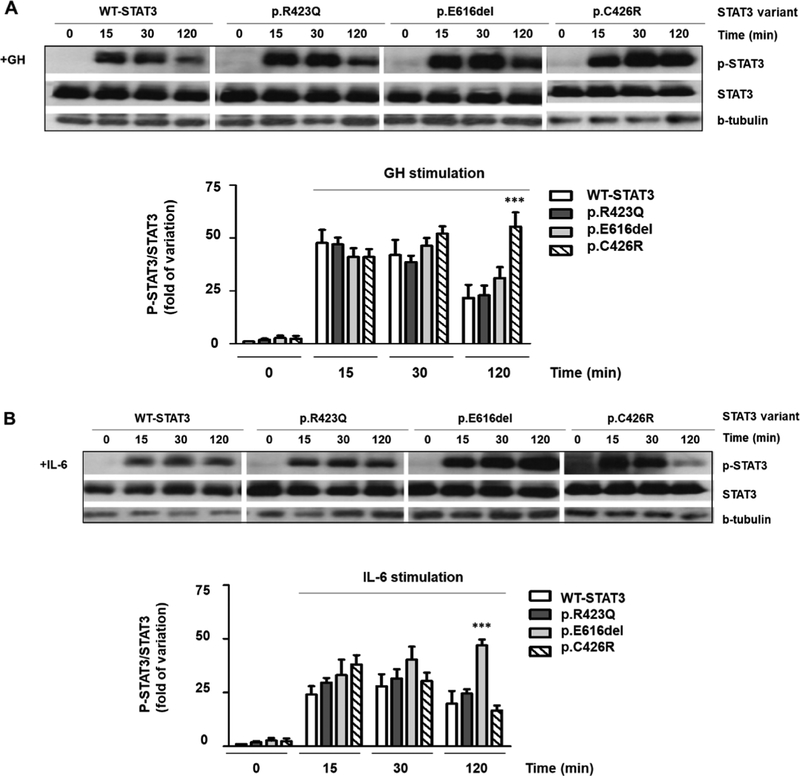
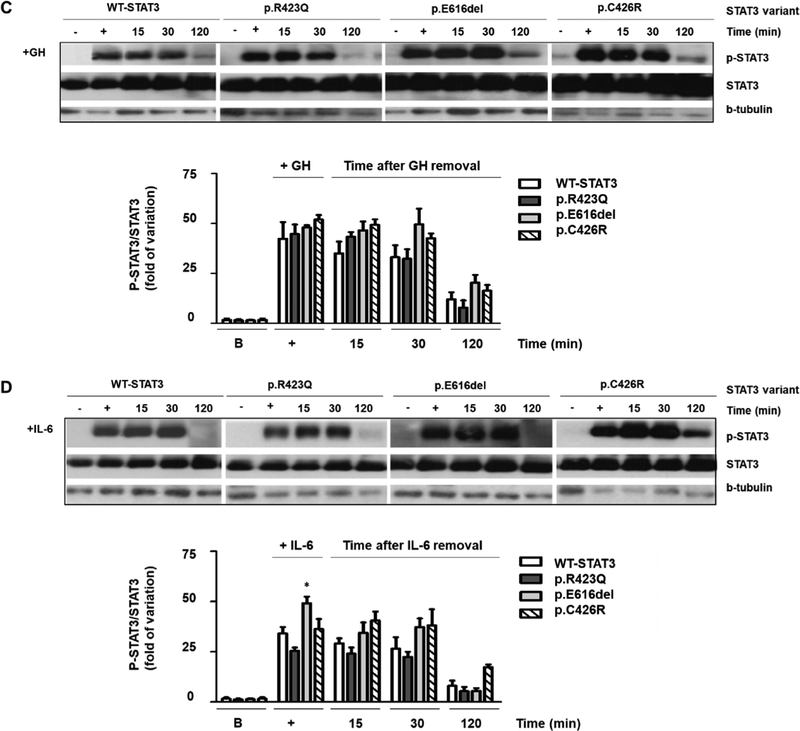
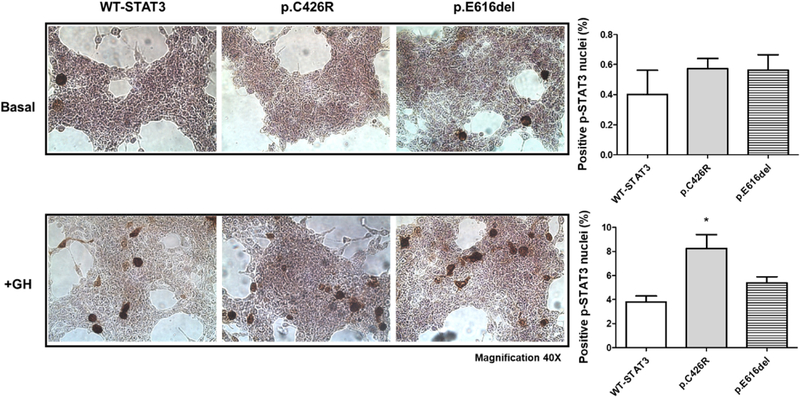
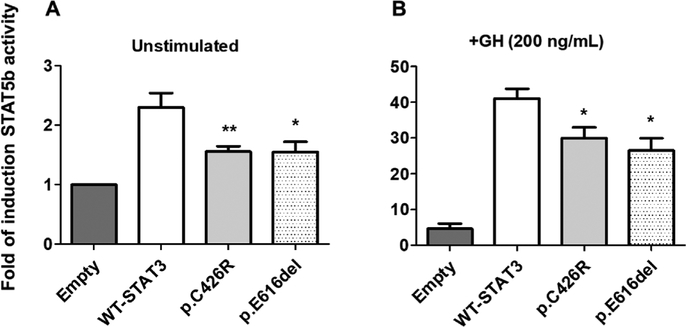
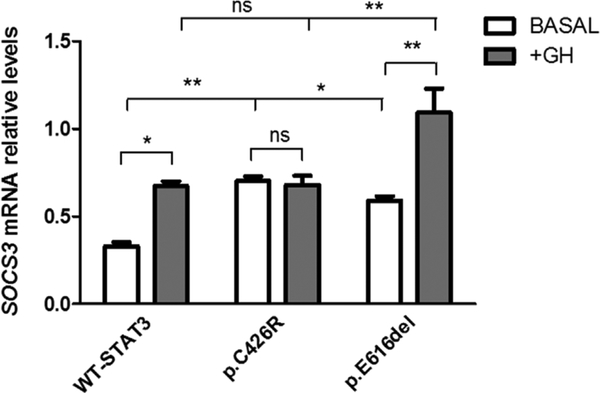
Germinal heterozygous activating STAT3 mutations represent a novel monogenic defect associated with multi-organ autoimmune disease and, in some cases, severe growth retardation. By using whole-exome sequencing, we identified two novel STAT3 mutations, p.E616del and p.C426R, in two unrelated pediatric patients with IGF-I deficiency and immune dysregulation. The functional analyses showed that both variants were gain-of-function (GOF), although they were not constitutively phosphorylated. They presented differences in their dephosphorylation kinetics and transcriptional activities under interleukin-6 stimulation. Both variants increased their transcriptional activities in response to growth hormone (GH) treatment. Nonetheless, STAT5b transcriptional activity was diminished in the presence of STAT3 GOF variants, suggesting a disruptive role of STAT3 GOF variants in the GH signaling pathway. This study highlights the broad clinical spectrum of patients presenting activating STAT3 mutations and explores the underlying molecular pathway responsible for this condition, suggesting that different mutations may drive increased activity by slightly different mechanisms.

Keywords: Activating mutations; Growth hormone insensitivity; IGF-I deficiency; Immune dysregulation; STAT3.


Conflict of interest statement

Declaration of interest

The authors declare no conflict of interest.

Figures

Fig. 1.
Fig. 1.
Schematics of human STAT3. The position of the two de novo mutations are shown below the STAT3 domains. Multiple sequence alignments among different species and among STAT proteins were done with PRALINE software. The color scheme indicates the least conserved alignment position (dark blue), to the most conserved alignment position (red). (For interpretation of the references to color in this figure legend, the reader is referred to the Web version of this article.)
Fig. 2.
Fig. 2.
A) Structural model of the STAT3 dimer bound to DNA (PDB ID: 1BG1) (Becker et al., 1998) in cartoon representation. Individual domains are color coded as in Fig. 1 only on the left chain. Variant residues under study are shown as space-filling mode in magenta. B) The structure has been rotated and expanded to show residues E616 and C426 (sticks) close to the DNA duplex surface. C) Surface representation of the predicted hydrophobicity of WT-STAT3 (left) and variants p.C426R (center) and p.E616del (right). Coloring was achieved using the color_h.py python script in Pymol, and the color scale is based on the Eisenberg normalized hydrophobicity scale (Eisenberg et al., 1984) where hydrophilic residues are lighter/white, and hydrophobic residues are darker/red. Both variants show an increase in the hydrophobicity surface in regions where the residues were substituted or deleted. D) Electrostatic potentials are mapped onto the molecular surfaces of WT-STAT3 and mutants, with negative potentials colored red and positive potentials colored blue. The electrostatic potentials were calculated and visualized using APBS plugin -Adaptive PoissoneBoltzmann Solver (Baker et al., 2001)- in Pymol. The variants (center and right) show an increase in the positive electrostatic potential on the DNA binding surface compared to WT-STAT3 (left). (For interpretation of the references to color in this figure legend, the reader is referred to the Web version of this article.)
Fig. 3.
Fig. 3.
STAT3 transcriptional activity determined by luciferase reporter assay. A) STAT3 activity of WT and variants, p.E616del, p.C426R and LOF variant, p.R423Q, under non-stimulated conditions. Data represents the mean ratio of firefly/control luciferase activity for each construct ± SEM (n = 5). B) STAT3 activity of WT and mutants following 18 h activation with GH (200 ng/mL, black) or IL-6 (20 ng/mL, gray). Data are presented as average fold of change relative to WT ± SEM of at least 5 independent experiments. The dotted line represents a fold-change of 1 (no change from WT). C) The same experiment as B) but data are presented as the mean ratio of firefly/control for each construct ± SEM (n = 5) under GH (200 ng/mL, black) or IL-6 (20 ng/mL, gray) 18-h treatment in comparison with unstimulated conditions. *P < 0.05, **P < 0.01, ***P < 0.001, t-test.
Fig. 4.
Fig. 4.
Western Blot of STAT3 expression and phosphorylation. WT-STAT3 and mutants were transfected in HEK293-T cells expressing GHR and p-STAT3 and total STAT3 were determined under basal (B, 0 min) or stimulated conditions (15, 30, 120 min). GH (200 ng/mL) (A) and IL-6 (20 ng/mL) (B) induced phosphorylation of WT-STAT3 and mutants. p-STAT3 and total STAT3 were additionally evaluated at 15, 30 and 120 min after removing a 30-min treatment with GH (+, 200 ng/mL) (C) and IL-6 (+, 20 ng/mL) (D). β-tubulin was used as loading control. p-STAT3, phosphorylated STAT3. The upper panels show representative autoradiographies out of three. The lower panels show pooled data of three independent experiments indicating the fold variation in phosphorylation (ratio of p-STAT3 to total STAT3 in each sample) relative to WT-STAT3 for each time point. Results are expressed as means ± S.E.M. *P < 0.05, **P < 0.01, ***P < 0.001, t-test.
Fig. 4.
Fig. 4.
Western Blot of STAT3 expression and phosphorylation. WT-STAT3 and mutants were transfected in HEK293-T cells expressing GHR and p-STAT3 and total STAT3 were determined under basal (B, 0 min) or stimulated conditions (15, 30, 120 min). GH (200 ng/mL) (A) and IL-6 (20 ng/mL) (B) induced phosphorylation of WT-STAT3 and mutants. p-STAT3 and total STAT3 were additionally evaluated at 15, 30 and 120 min after removing a 30-min treatment with GH (+, 200 ng/mL) (C) and IL-6 (+, 20 ng/mL) (D). β-tubulin was used as loading control. p-STAT3, phosphorylated STAT3. The upper panels show representative autoradiographies out of three. The lower panels show pooled data of three independent experiments indicating the fold variation in phosphorylation (ratio of p-STAT3 to total STAT3 in each sample) relative to WT-STAT3 for each time point. Results are expressed as means ± S.E.M. *P < 0.05, **P < 0.01, ***P < 0.001, t-test.
Fig. 5.
Fig. 5.
HEK293-T cells overexpressing WT-STAT3 and variants were examined immunohistochemically for p-STAT3 (tyr705) detection under unstimulated conditions (upper panels) and after 2 h-GH treatment (200 ng/mL, lower panels). Number of positive p-STAT3 nuclei were normalized to total cells and expressed as Mean ± SEM from at least six random microscopic field images of two independent experiments. Mann-Whitney test (*P < 0.05) was used to compare positive p-STAT3 nuclei between cells expressing STAT3-GOF variants and WT-STAT3. Representative images are shown (Magnification 40 ×).
Fig. 6.
Fig. 6.
STAT5b transcriptional activity in presence of WT-STAT3 or variants determined by luciferase reporter assay. (A) STAT5b activity in presence of WT-STAT3, p.C426R and p.E616del STAT3 variants under non-stimulated conditions. (B) Cells co-transfected with STAT5b, WT-STAT3 or variants, and pGHRE-LUC were treated with GH (200 ng/mL, 18 h) and cell lysates were analyzed for luciferase activities. Luciferase activities were normalized to total protein and expressed as Mean ± SEM from at least five independent experiments, each performed in duplicates. The normalized luciferase activity for Empty-pcDNA3.1 was set to an arbitrary value of 1. Relative induction of STAT5b transcriptional activity in presence of STAT3-GOF variants was compared to that in presence of WT-STAT3 using Mann-Whitney test (*P < 0.05 and **P < 0.01 vs. WT-STAT3).
Fig. 7.
Fig. 7.
SOCS3 mRNA levels were determined under unstimulated conditions or after 18 h-GH treatment (200 ng/mL) in HEK293-T cells expressing WT-STAT3 or variants. SOCS3 transcript levels were normalized to TBP. Data represent the mean ± SEM, n = 3. *P < 0.05, **P < 0.01, t-test.

References

    1. Adzhubei I.a, Schmidt S, Peshkin L, Ramensky VE, Gerasimova A, Bork P, Kondrashov AS, Sunyaev SR, 2010. A method and server for predicting damaging missense mutations. Nat. Meth 7, 248–249. 10.1038/nmeth0410-248. - DOI - PMC - PubMed
    1. Akira S, 2000. Roles of STAT3 defined by tissue-specific gene targeting. Oncogene 19, 2607–2611. 10.1038/sj.onc.1203478. - DOI - PubMed
    1. Akira S, 1999. Functional roles of STAT family proteins: lessons from knockout mice. Stem Cell. 17, 138–146. 10.1002/stem.170138. - DOI - PubMed
    1. Baker NA, Sept D, Joseph S, Holst MJ, McCammon JA, 2001. Electrostatics of nanosystems: application to microtubules and the ribosome. Proc. Natl. Acad. Sci. U. S. A 98, 10037–10041. 10.1073/pnas.181342398. - DOI - PMC - PubMed
    1. Becker S, Groner B, Muller CW, 1998. Three-dimensional structure of the Stat3beta homodimer bound to DNA. Nature 394, 145–151. 10.1038/28101. - DOI - PubMed

Publication types

MeSH terms

Supplementary concepts