. 2018 Jan 30;6(1):20.
doi: 10.1186/s40168-018-0404-9.

Commensal microbiota modulate gene expression in the skin

Affiliations

Commensal microbiota modulate gene expression in the skin

Jacquelyn S Meisel et al. Microbiome. .

Abstract

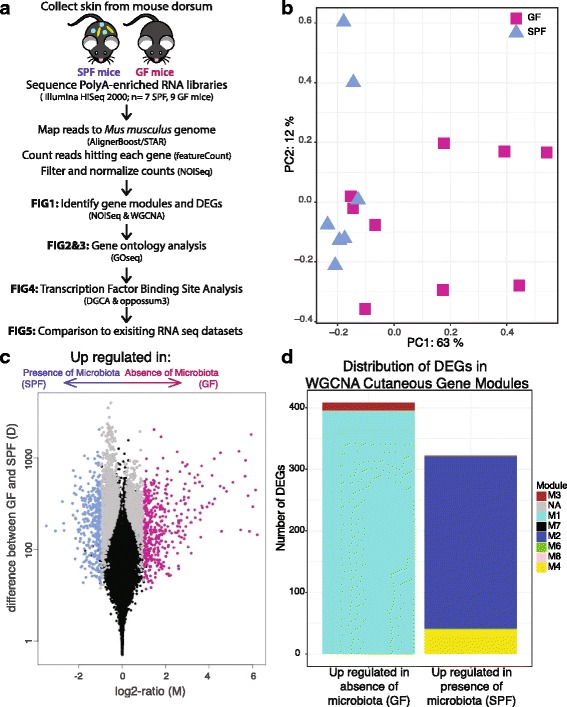
Background: The skin harbors complex communities of resident microorganisms, yet little is known of their physiological roles and the molecular mechanisms that mediate cutaneous host-microbe interactions. Here, we profiled skin transcriptomes of mice reared in the presence and absence of microbiota to elucidate the range of pathways and functions modulated in the skin by the microbiota.

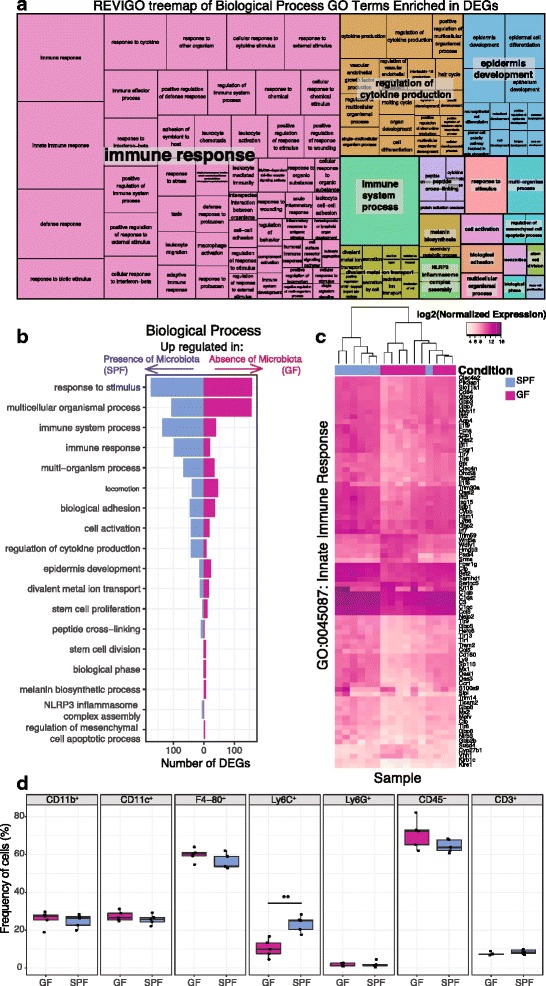
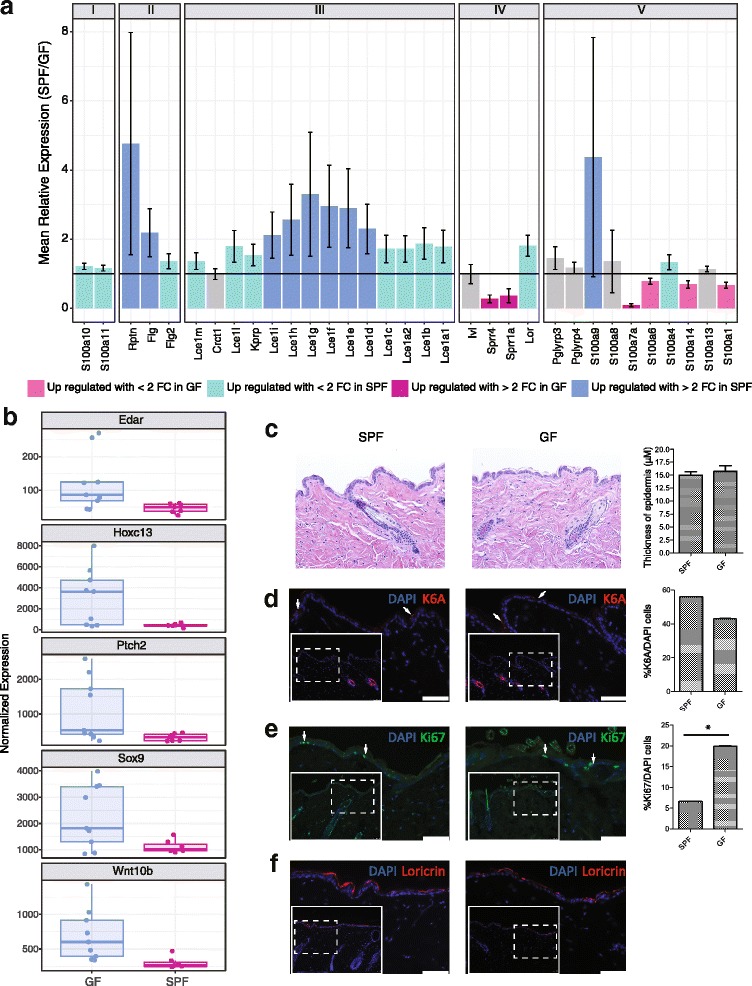
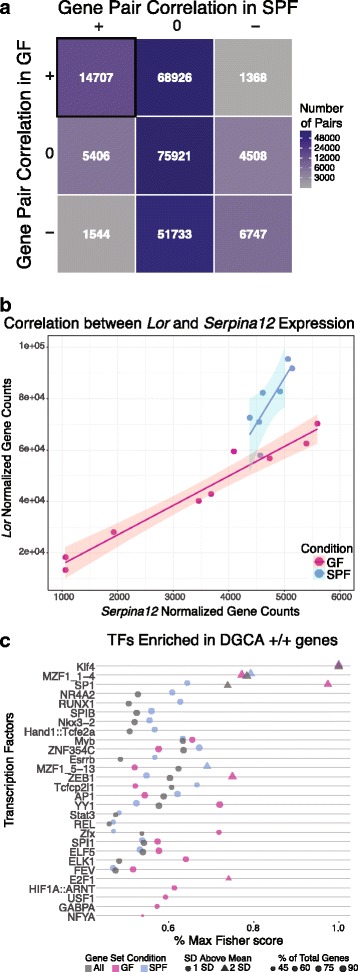
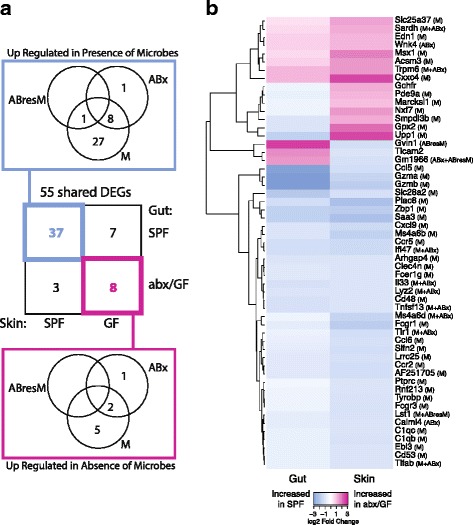
Results: A total of 2820 genes were differentially regulated in response to microbial colonization and were enriched in gene ontology (GO) terms related to the host-immune response and epidermal differentiation. Innate immune response genes and genes involved in cytokine activity were generally upregulated in response to microbiota and included genes encoding toll-like receptors, antimicrobial peptides, the complement cascade, and genes involved in IL-1 family cytokine signaling and homing of T cells. Our results also reveal a role for the microbiota in modulating epidermal differentiation and development, with differential expression of genes in the epidermal differentiation complex (EDC). Genes with correlated co-expression patterns were enriched in binding sites for the transcription factors Klf4, AP-1, and SP-1, all implicated as regulators of epidermal differentiation. Finally, we identified transcriptional signatures of microbial regulation common to both the skin and the gastrointestinal tract.

Conclusions: With this foundational approach, we establish a critical resource for understanding the genome-wide implications of microbially mediated gene expression in the skin and emphasize prospective ways in which the microbiome contributes to skin health and disease.

Keywords: Cutaneous transcriptome; Germ-free mice; Host-microbe interactions; RNA sequencing; Skin microbiome.


Conflict of interest statement

Ethics approval and consent to participate

All mouse experiments were approved by the University of Pennsylvania Institutional Animal Care and Use Committee (IACUC).

Consent for publication

Not applicable.

Competing interests

The authors declare that they have no competing interests.

Publisher’s Note

Springer Nature remains neutral with regard to jurisdictional claims in published maps and institutional affiliations.

Figures

Fig. 1
Fig. 1
Gene expression profiles differ between SPF and GF skin. a Dorsal skin collected from GF and SPF mice was subject to polyA-enriched RNA sequencing to identify transcriptional modulation by skin microbial communities. b NMDS plot based on filtered, normalized, batch effect-corrected read counts from each sample, showing that samples cluster together by condition. Blue triangles indicate SPF samples, and magenta squares indicate GF samples. c Volcano plot highlighting differentially expressed genes. Each dot represents a gene. Gray dots indicate DEGs. Magenta dots indicate DEGs with at least twofold enrichment in GF mice, while blue dots indicate DEGs with at least twofold enrichment in SPF mice. The x-axis is the log fold change in normalized gene expression and the y-axis depicts the log10 absolute value of the difference in expression between the two conditions. d Barplot indicating WGCNA gene modules to which the 730 DEGs with a twofold difference belong
Fig. 2
Fig. 2
Gene ontology analysis identifies immune response terms enriched in DEGs. a REVIGO treemap showing cluster representatives of Biological Process GO terms that are significantly enriched in the DEGs (FDR-corrected p value < 0.05). Larger boxes indicate greater significance, as the box sizes are determined by the absolute value of the log10 p value. b Barplot depicting the number of DEGs in each of the high-level significant Biological Process GO terms from part A. c Heatmap of the log normalized gene expression of DEGs in the GO term “Innate Immune Response”. d Flow cytometry analysis of GF and SPF mice (n = 5 each) identified no significant differences between GF and SPF skin in regard to myeloid (CD11b+) cells, dendritic (CD11c+) cells, macrophages (F4-80+), neutrophils (Ly6G+), non-hematopoietic (CD45) cells, and T cells (CD3+). However, Ly6C+ monocytes were significantly increased in frequency in SPF compared to GF skin (T test, p value < 0.01). All populations (except CD45) were pre-gated on live, CD45+ cells
Fig. 3
Fig. 3
Genes in the epidermal differentiation complex (EDC) are under microbial regulation. a The mean relative expression of genes found in the EDC in SPF compared to GF mice. A value of 1 indicates equal expression in the two groups. Colors of the bars indicate DEGs, and error bars represent propagated SE of the ratio SPF/GF. EDC genes are grouped as previously described [35]. b Boxplot of normalized gene expression of differentially expressed transcription factors and regulators critical to skin developmental processes. cf Histology and immunofluorescence staining of SPF and GF skin sections. Dotted line inset boxes indicate the area that is magnified in the figure to orient the reader. White arrowheads are examples of positive cells. Significance testing was performed on an aggregate of three experiments with 3 GF and 3 SPF mice each. A * indicates a p value < 0.05 by T test. Scale bars represent 50 μm. c Hematoxylin and eosin staining and epidermal thickness measurements. d Cytokeratin 6A (K6A) staining. e Ki67 staining for proliferating cells. f Loricrin staining as a marker of differentiation
Fig. 4
Fig. 4
DGCA analysis identified significantly correlated DEGs that share potential transcription factor binding sites. a Matrix highlighting the number of significantly correlated gene pairs from the filtered list of DEGs. Each axis represents a condition (GF or SPF), with + indicating a significant positive correlation between the gene pair, − indicating a significant negative correlation, and 0 indicating the lack of a significant correlation. Gene pairs that are positively correlated in both SPF and GF skin are highlighted in the uppermost left corner. b The Loricrin and Serpina12 gene pair is positively correlated in both colonization conditions, but a significant loss of correlation is observed in SPF compared to GF skin (q < 0.05). The x- and y-axes indicate the TMM normalized, batch effect-corrected gene counts, and each dot represents a single mouse, colored by their microbial condition. Colored lines and shaded areas represent the linear regression lines and their respective 95% confidence interval for each microbial condition. c Analysis with oppossum3 identified enriched transcription factors in positively correlated DGCA gene sets, using Fisher scores to assess significance. The y-axis identifies significant transcription factors, while x-axis represents the significance metric. Higher values indicate greater significance and the shape indicates whether the metric score was 1 or 2 standard deviations (SD) above the mean. Fisher scores are significant when greater than 1 SD above the mean. Size of each point reflects the percentage of all DGCA +/+ DEGs containing a binding region for each TF and color indicates colonization status of the DGCA +/+ DEGs
Fig. 5
Fig. 5
Comparison to published gut transcriptome dataset identifies shared DEGs under microbial regulation. a Venn diagrams highlighting 55 DEGs shared between skin and gut that are regulated by the microbiota. Gut transcriptome data was downloaded from a previously published study [23]. The center square identifies the total number of shared DEGs between the skin (x-axis) and gut (y-axis) datasets in each colonization category. The Venn diagrams highlight DEGs upregulated in the presence (blue, top) and absence (magenta, bottom) of microbiota, respectively, and whether these genes were differentially regulated in the gut in response to microbial colonization (M), colonization of antibiotic resistant microbes (ABresM), or direct effects of antibiotics on host tissue (ABx) or any combination of the above. b Heatmap showing log2 fold change of the 55 DEGs shared between the gut and skin datasets, with parenthesis next to gene names indicating whether these genes were differentially regulated in the gut in response to microbial colonization (M), colonization of antibiotic resistant microbes (ABresM), direct effects of antibiotics on host tissue (ABx), or any combination of the above

References

    1. Grice EA, Kong HH, Conlan S, Deming CB, Davis J, Young AC, NISC Comparative Sequencing Program. Bouffard GG, Blakesley RW, Murray PR, Green ED, Turner ML, Segre JA. Topographical and temporal diversity of the human skin microbiome. Science. 2009;324:1190–1192. doi: 10.1126/science.1171700. - DOI - PMC - PubMed
    1. Grice EA, Segre JA. The skin microbiome. Nat Publ Group. 2011;9:244–253. - PMC - PubMed
    1. Hannigan GD, Meisel JS, Tyldsley AS, Zheng Q, Hodkinson BP, SanMiguel AJ, Minot S, Bushman FD, Grice EA. The human skin double-stranded DNA virome: topographical and temporal diversity, genetic enrichment, and dynamic associations with the host microbiome. MBio. 2015;6:e01578–e01515. doi: 10.1128/mBio.01578-15. - DOI - PMC - PubMed
    1. Oh J, Byrd AL, Deming C, Conlan S, NISC Comparative Sequencing Program. Kong HH, Segre JA. Biogeography and individuality shape function in the human skin metagenome. Nature. 2014;514:59–64. doi: 10.1038/nature13786. - DOI - PMC - PubMed
    1. Lai Y, Di Nardo A, Nakatsuji T, Leichtle A, Yang Y, Cogen AL, Wu Z-R, Hooper LV, Schmidt RR, Aulock Von S, Radek KA, Huang C-M, Ryan AF, Gallo RL. Commensal bacteria regulate toll-like receptor 3-dependent inflammation after skin injury. Nat Med. 2009;15:1377–1382. doi: 10.1038/nm.2062. - DOI - PMC - PubMed

Publication types