. 2018 Jan 30:7:e31299.
doi: 10.7554/eLife.31299.

Therapeutic effects of telomerase in mice with pulmonary fibrosis induced by damage to the lungs and short telomeres

Affiliations

Therapeutic effects of telomerase in mice with pulmonary fibrosis induced by damage to the lungs and short telomeres

Juan Manuel Povedano et al. Elife. .

Abstract

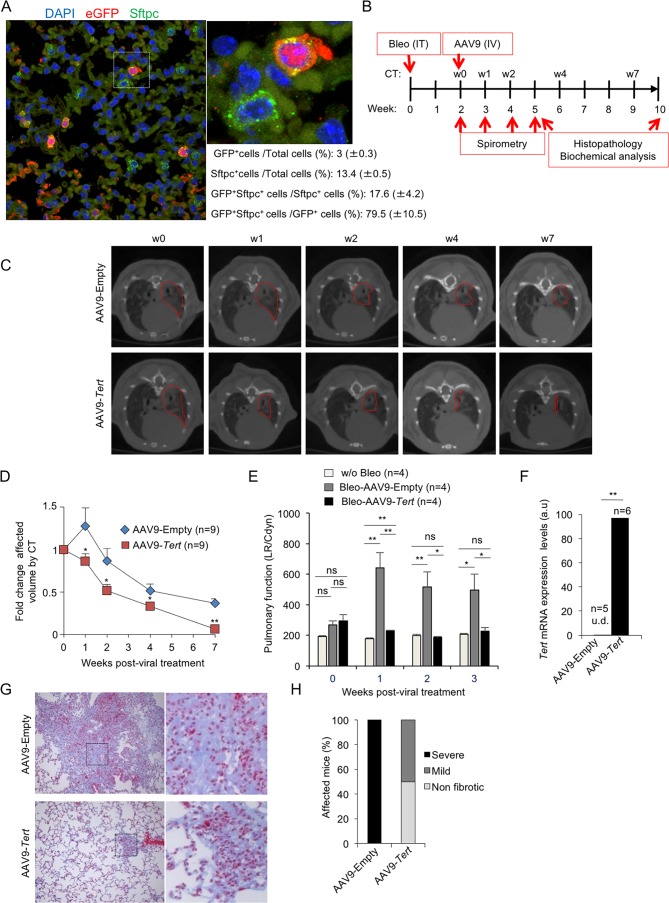
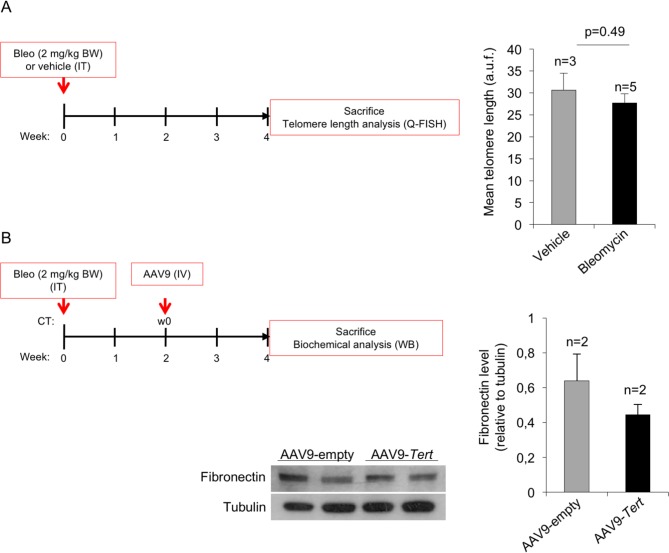
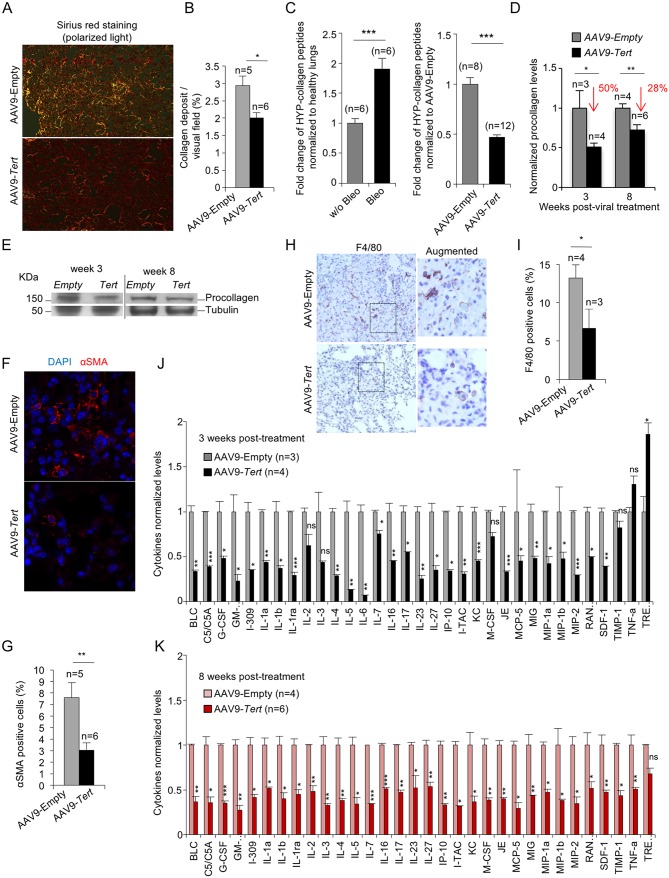
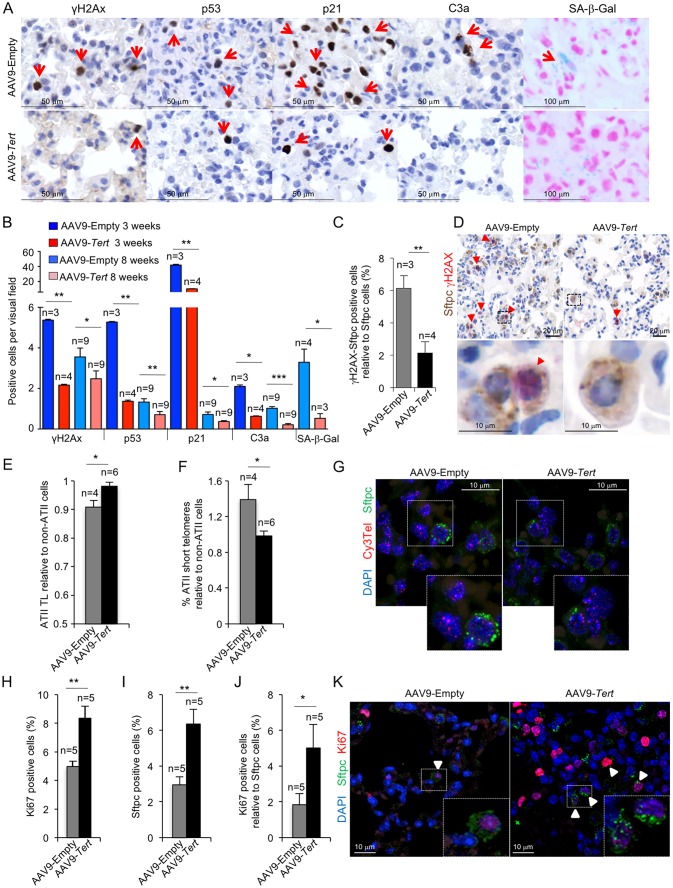
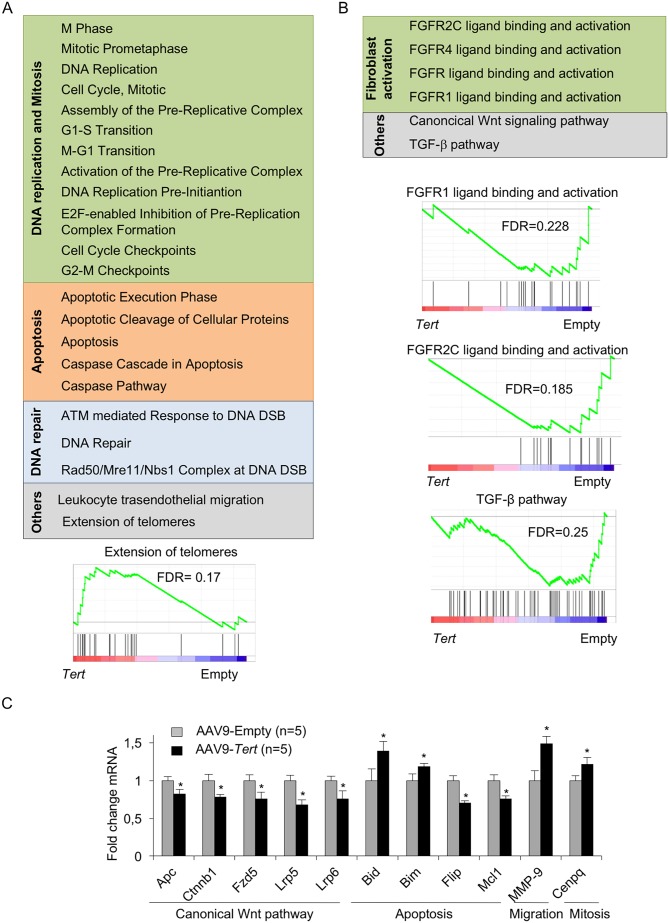
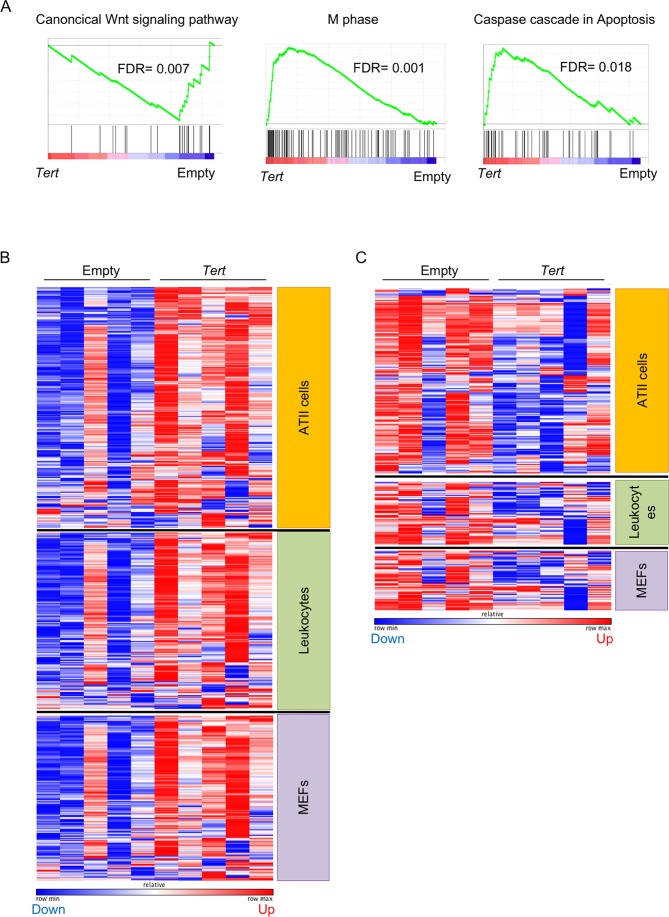
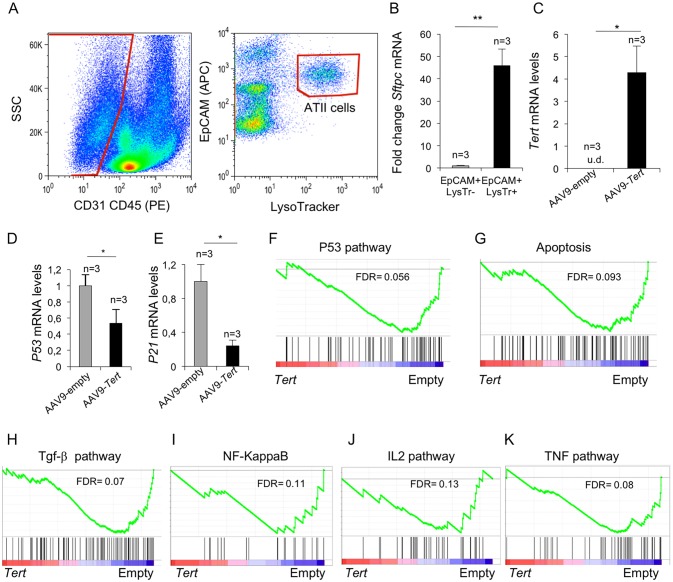
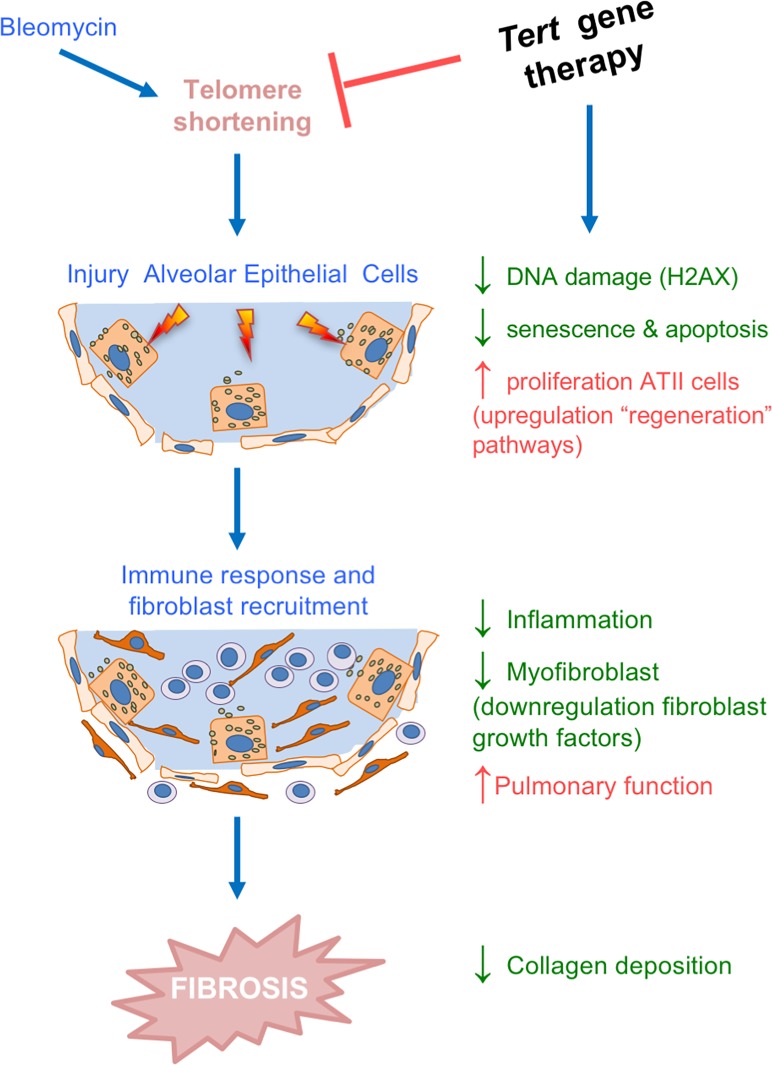
Pulmonary fibrosis is a fatal lung disease characterized by fibrotic foci and inflammatory infiltrates. Short telomeres can impair tissue regeneration and are found both in hereditary and sporadic cases. We show here that telomerase expression using AAV9 vectors shows therapeutic effects in a mouse model of pulmonary fibrosis owing to a low-dose bleomycin insult and short telomeres. AAV9 preferentially targets regenerative alveolar type II cells (ATII). AAV9-Tert-treated mice show improved lung function and lower inflammation and fibrosis at 1-3 weeks after viral treatment, and improvement or disappearance of the fibrosis at 8 weeks after treatment. AAV9-Tert treatment leads to longer telomeres and increased proliferation of ATII cells, as well as lower DNA damage, apoptosis, and senescence. Transcriptome analysis of ATII cells confirms downregulation of fibrosis and inflammation pathways. We provide a proof-of-principle that telomerase activation may represent an effective treatment for pulmonary fibrosis provoked or associated with short telomeres.

Keywords: AAV9; chromosomes; gene therapy; genes; mouse; pulmonary fibrosis; telomerase; telomeres.


Conflict of interest statement

JP, PM, RS, ÁT, GG, JF, FB, MB No competing interests declared, MB is an employee for F. Hoffmann-La Roche Ltd, and the author declares no other competing financial interests

Figures

Figure 1.
Figure 1.. AAV9-Tert treatment targets ATII cells leading to remission of pulmonary fibrosis.
(A) Representative image of immunofluorescence against eGFP (in red) and Sftpc (in green). Mice were injected intravenously in the tail with AAV9-eGFP and sacrificed two weeks later to determine virus cell type target. The quantification of percentage of GFP+ Sftpc+ cells relative to total GFP+ cells and to total Sftpc+ cells is shown. (B) Eight-ten week old male G2Tert-/- mice were intratracheally inoculated with 0.5 mg/kg BW bleomycin and two weeks after computed tomography (CT)-diagnosed with pulmonary fibrosis (PF). Affected mice were treated intravenously either with AAV9-empty or AAV9-Tert. Spirometric follow–up was performed at 1, 2 and 3 weeks post-viral treatment with the viral vectors. CT follow-up was performed at 1, 2, 4 and 7 weeks post-treatment with the viral vectors. Mice were sacrificed at 3 and 8 weeks post-treatment with the viral vectors for further biochemical and histopathological lung examination. (C) CT representative images for every time point of the treatment (fibrotic area in red). (D) Quantification of fold change affected lung volume with PF normalized to the affected volume before the viral treatment by computed tomography (CT). (E) Follow-up of pulmonary function measured as the ratio between lung resistance and dynamic compliance (LR/Cdyn) (F) Tert transcriptional levels in lung 8 weeks post-viral treatment. a.u., arbitrary units (G) Masson´s trichrome staining from lung sections to evaluate fibrotic regions at end point 8 weeks post-viral treatment (collagen fibers in blue; nuclei and erythrocytes in red). (H) Histopathological analysis and fibrosis score from lung sections at end point. The number of mice analyzed per group is indicated. T-test was used in D, E and F and χ2 analysis in H and I for statistical analysis. *p=0.05; **p<0.01.
Figure 1—figure supplement 1.
Figure 1—figure supplement 1.. High dose of bleomycin induces pulmonary fibrosis without affecting telomere length in lung cells.
(A) Eight-ten week old wild type mice were intratracheally inoculated either with 2 mg/kg body weight bleomycin or with vehicle and sacrificed after four weeks to measure telomere length by Q-FISH in lung sections (B) Eight-ten week old wild type mice were intratracheally inoculated with 2 mg/kg body weight bleomycin and two weeks after computed tomography (CT) diagnosed with pulmonary fibrosis (PF). Affected mice were treated intravenously either with AAV9-Empty or AAV9-Tert and sacrificed after two weeks to quantify fibronectin levels by western blot. Representative Western Blot images are shown. T-test was used for statistical analysis. Error bars represent standard error. The number of mice analyzed per group is indicated. a.u.f., arbitrary units of fluorescence.
Figure 2.
Figure 2.. AAV9-Tert treatment leads to lower collagen deposition, less inflammation and decreased active fibrotic foci.
(A) Representative images of picosirius red staining visualized by polarized light where collagen fibers are bright orange from mice treated either with AAV9-Tert or empty vector 8 weeks post-viral treatment. (B) Percent of lung area filled with collagen fibers 8 weeks post-viral treatment. (C) Quantification of specific collagen peptides containing hydroxyproline in healthy lungs without bleomycin and in fibrotic lungs 5 weeks after bleomycin insult (left panel) and in lungs treated either with Tert or empty vector at 8 weeks post-treatment (right panel). (D–E) Quantification of total procollagen levels (D) and representative Western Blot images (E) in lung samples of AVV9-Tert and AVV9-empty infected lungs at 3 and 8 weeks post-viral treatment. (F) Representative images of immunofluorescence for αSMA (in red) and DAPI (in blue) at 8 weeks post-viral treatment. (G) Quantification of αSMA positive cells at 8 weeks post-treatment. (H) Representative images of F4/80 (macrophage specific marker) immunohistochemistry staining in AAV9-Empty and AAV9-Tert treated mice at 8 weeks post-viral treatment. (I) Quantification of F4/80 positive cells at 8 weeks post-viral treatment. (J–K) Quantification of the indicated cytokines in lung samples of AVV9-Tert and AVV9-empty infected lungs at 3 (J) and 8 (K) weeks post-viral treatment. Data represent the mean ±SE of analyzed mice within each group. The number of mice analyzed per group is indicated. T-test was used for statistical analysis. *p=0.05; **p<0.01; ***p<0.001.
Figure 3.
Figure 3.. AAV9-Tert treatment reduces DNA damage, improves telomere maintenance and proliferation in ATII cells.
(A) Representative images for γH2AX, p53, p21, active caspase 3 (C3a) and SA-β-Gal stained lungs at 3 weeks post-viral treatment. (B) Quantification of γH2AX, p53, p21, C3a and SA-β-Gal positive cells per visual field of lungs treated either with Tert or empty vector at 3 and 8 weeks post-viral treatment. (C) percentage of damaged (γH2AX positive) ATII cells (Stfpc positive) in lungs treated either with Tert or empty vector at three post-viral treatment. (D) Representative images of double immunohistochemistry against Stfpc (brown) and γH2AX (red) of lungs treated either with Tert or empty vector at three post-viral treatment. (E–F) Fold change in telomere length (E) and percentage of short telomeres (F) in ATII cells relative to non-ATII cells at 8 weeks post-viral treatment. (G) Representative images of immuno-QFISH with Cy3Telomere probe (in red), Sftpc (in green) and DAPI (in blue) in lungs at 8 weeks post-viral treatment. (H–J) Quantification of percentage of Ki67 positive cells (H), Sftpc positive cells (I) and Ki67 positive cells relative to Sftpc positive cells at 8 weeks post-viral treatment (J). (K) Representative images of double immunofluorescence against Sftpc (in green) and Ki67 (in red) in lungs at 8 weeks post-viral treatment. Data represent the mean ±SE of analyzed mice within each group. The number of mice analyzed per group is indicated. T-test was used for statistical analysis. *p=0.05; **p<0.01; ***p<0.001.
Figure 4.
Figure 4.. AAV9-Tert treatment induces transcriptional changes in the lungs.
(A–B) Summary table indicating various significantly (FDR < 0.25) upregulated (A) and downregulated (B) pathways in AAV9-Tert compared with AAV9-Empty treated lungs at 8 weeks post-viral treatment. Examples of GSEA plots for the indicated pathways are shown below. Microarray genes were ranked based on the two-tailed t-statistic tests obtained from the AAV9-Tert versus AAV9-Empty by pair-wise comparisons. The red to blue horizontal bar represents the ranked list. Those genes showing higher expression levels for each cohort are located at the edges of the bar (AAV9-Empty; AAV9-Tert). The genes located at the central area of the bar show small differences in gene expression fold changes between both groups. (C) Fold change mRNA expression levels of candidate genes related with canonical Wnt pathway, apoptosis, mitosis and transendothelial migration in AAV9-Tert relative to empty vector. For GSEA Kolmogorov–Smirnoff testing was used for statistical analysis. The FDR is calculated by Benjamini and Hochberg FDR correction. Data represent the mean ± SE of analyzed mice within each group. The number of mice analyzed per group is indicated. T-test was used for q-PCR statistical analysis. *p=0.05.
Figure 4—figure supplement 1.
Figure 4—figure supplement 1.. Differentially expressed genes from AAV9-Tert treated mice correlate with ATII cells gene expression signature.
(A) GSEA plots for the indicated pathways in lung tissue. Microarray genes were ranked based on the two-tailed t-statistic tests obtained from the AAV9-Tert versus AAV9-Empty by pair-wise comparisons. The red to blue horizontal bar represents the ranked list. Those genes showing higher expression levels for each cohort are located at the edges of the bar (AAV9-Empty; AAV9-Tert). The genes located at the central area of the bar show small differences in gene expression fold changes between both groups. For GSEA Kolmogorov–Smirnoff testing was used for statistical analysis. The FDR is calculated by Benjamini and Hochberg FDR correction. (B–C) Heat maps representing the upregulated genes (B) and downregulated genes (C) in AAV9-Tert compared to empty vector treated mice that corresponded to ATII cells, lung leukocytes and mouse embryonic fibroblast (MEFs). The size of the heat map for each cell type correlates with the amount of genes deregulated. The red/blue bars represent an over/down-expression of the gene in this sample compared with the other cohort.
Figure 4—figure supplement 2.
Figure 4—figure supplement 2.. Tert overexpression in fibrotic lungs mimic neonatal regenerative heart tissue after infarctation.
(A) GSEA plot for LAD/Sham List from Haubner et al. study. A heatmap of indicated core-enriched genes is displayed under the enrichment plot. Microarray genes were ranked based on the two-tailed t-statistic tests obtained from the AAV9-Tert versus AAV9-Empty by pair-wise comparisons. The red to blue horizontal bar represents the ranked list. Those genes showing higher expression levels for each cohort are located at the edges of the bar (AAV9-Empty; AAV9-Tert). The genes located at the central area of the bar show small differences in gene expression fold changes between both groups. (B) REACTOME Pathways differentially enriched with genes of the core-enriched from the previous GSEA. For GSEA Kolmogorov–Smirnoff testing was used for statistical analysis. The FDR is calculated by Benjamini and Hochberg FDR correction.
Figure 5.
Figure 5.. Isolated ATII cells overexpress Tert and show downregulation of DDR- and inflammatory- related pathway.
(A) FACs representative dot plots of lungs one week post either AAV9-Empty or AAV9-Tert treatment. The epithelial cell population was identified as CD31/CD45 double negative. ATII cells were identified by LysoTracker and EpCAM doubly positive cells and isolated by cell sorting. (B) Validation of specific ATII cells marker Sftpc by RT-qPCR. (C) Transcriptional levels of Tert in isolated ATII cells from lungs treated with the indicated vectors. (D–E) mRNA expression levels of p53 (C) and p21 (D) genes in ATII by RT-qPCR from lungs treated with the indicated vectors. (F–G) GSEA plots for the indicated downregulated DDR related pathways in AAV9-Tert infected ATII cells. (H–K) GSEA plots for the indicated downregulated inflammatory related pathways in AAV9-Tert infected ATII cells. Microarray genes were ranked based on the two-tailed t-statistic tests obtained from the AAV9-Tert versus AAV9-Empty by pair-wise comparisons. The red to blue horizontal bar represents the ranked list. Those genes showing higher expression levels for each cohort are located at the edges of the bar (AAV9-Empty; AAV9-Tert). The genes located at the central area of the bar show small differences in gene expression fold changes between both groups. Data represent the mean ±SE of analyzed mice within each group. The number of mice analyzed per group is indicated. T-test was used for RT-qPCR statistical analysis. *p=0.05; **p<0.01. For GSEA Kolmogorov–Smirnoff testing was used for statistical analysis. The FDR is calculated by Benjamini and Hochberg FDR correction.
Figure 6.
Figure 6.. Tert gene therapy targets the basis of pulmonary fibrosis.
Proposed model for the mechanism underlying Tert gene therapy. AAV9-Tert therapy targets one of the molecular causes of the disease, short telomeres (Alder et al., 2008; Armanios et al., 2007; Povedano et al., 2015), resulting in decreased DNA damage, senescence/apoptosis and improved proliferative potential of the ATII cells and subsequently decreasing inflammation and fibrosis.
Author response image 1.
Author response image 1.. Mean telomere length in wild type and fibrotic Fra2 Knock-in mice.

Similar articles

Cited by

References

    1. Adamson IY, Bowden DH. The pathogenesis of bleomycin-induced pulmonary fibrosis in mice. The American Journal of Pathology. 1974;77:185–197. - PMC - PubMed
    1. Ahluwalia N, Shea BS, Tager AM. New therapeutic targets in idiopathic pulmonary fibrosis. Aiming to rein in runaway wound-healing responses. American Journal of Respiratory and Critical Care Medicine. 2014;190:867–878. doi: 10.1164/rccm.201403-0509PP. - DOI - PMC - PubMed
    1. Alder JK, Chen JJ, Lancaster L, Danoff S, Su SC, Cogan JD, Vulto I, Xie M, Qi X, Tuder RM, Phillips JA, Lansdorp PM, Loyd JE, Armanios MY. Short telomeres are a risk factor for idiopathic pulmonary fibrosis. PNAS. 2008;105:13051–13056. doi: 10.1073/pnas.0804280105. - DOI - PMC - PubMed
    1. Alder JK, Guo N, Kembou F, Parry EM, Anderson CJ, Gorgy AI, Walsh MF, Sussan T, Biswal S, Mitzner W, Tuder RM, Armanios M. Telomere length is a determinant of emphysema susceptibility. American Journal of Respiratory and Critical Care Medicine. 2011;184:904–912. doi: 10.1164/rccm.201103-0520OC. - DOI - PMC - PubMed
    1. Armanios M, Blackburn EH. The telomere syndromes. Nature Reviews Genetics. 2012;13:693–704. doi: 10.1038/nrg3246. - DOI - PMC - PubMed

Publication types