Review
. 2018 Apr 2;217(4):1181-1191.
doi: 10.1083/jcb.201710038. Epub 2018 Jan 29.

Visualizing transcription factor dynamics in living cells

Affiliations
Review

Visualizing transcription factor dynamics in living cells

Zhe Liu et al. J Cell Biol. .

Abstract

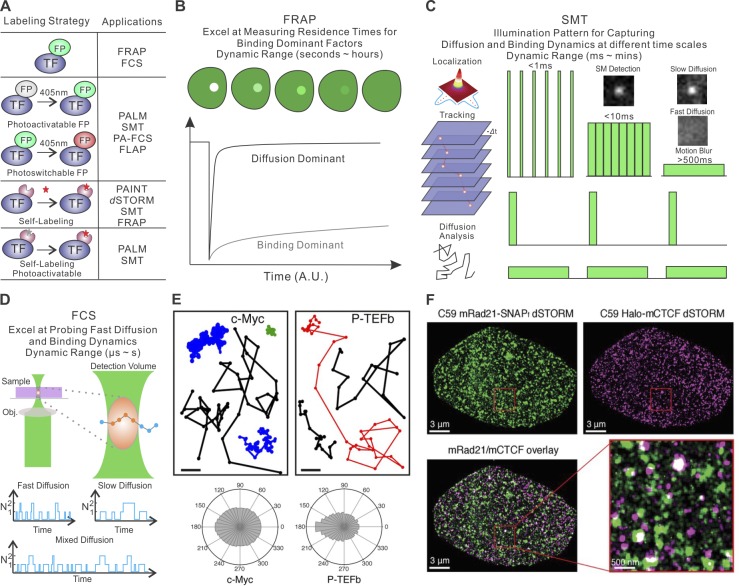
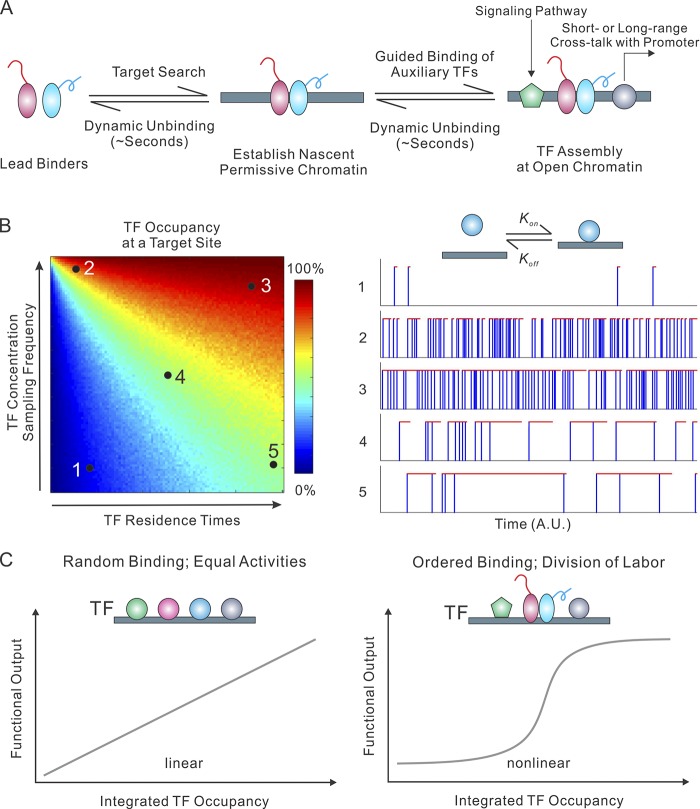
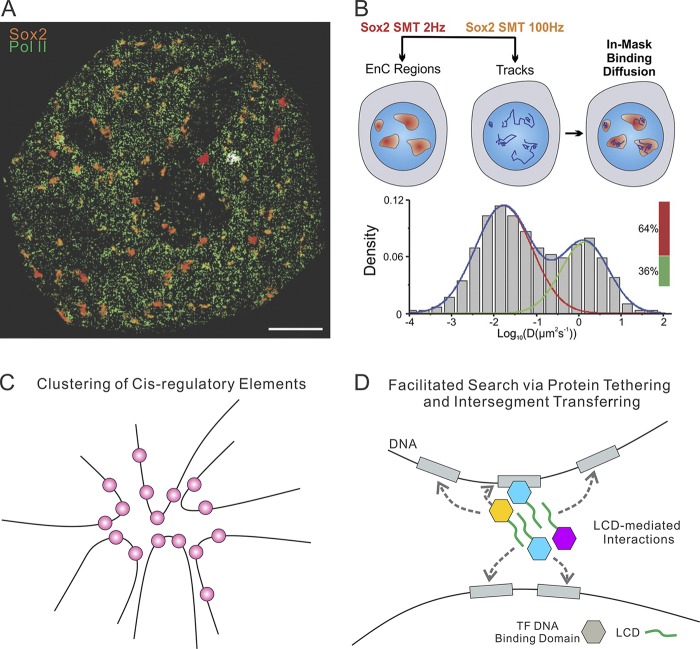
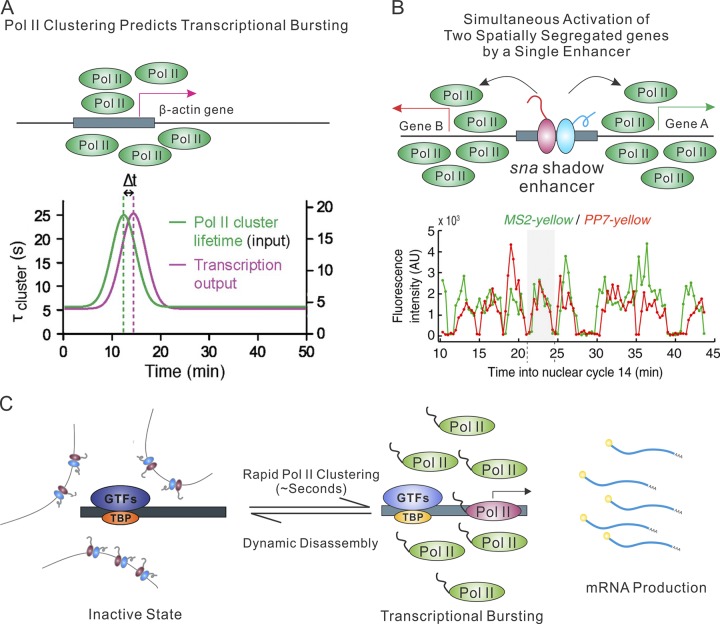
The assembly of sequence-specific enhancer-binding transcription factors (TFs) at cis-regulatory elements in the genome has long been regarded as the fundamental mechanism driving cell type-specific gene expression. However, despite extensive biochemical, genetic, and genomic studies in the past three decades, our understanding of molecular mechanisms underlying enhancer-mediated gene regulation remains incomplete. Recent advances in imaging technologies now enable direct visualization of TF-driven regulatory events and transcriptional activities at the single-cell, single-molecule level. The ability to observe the remarkably dynamic behavior of individual TFs in live cells at high spatiotemporal resolution has begun to provide novel mechanistic insights and promises new advances in deciphering causal-functional relationships of TF targeting, genome organization, and gene activation. In this review, we review current transcription imaging techniques and summarize converging results from various lines of research that may instigate a revision of models to describe key features of eukaryotic gene regulation.


Figures

Figure 1.
Figure 1.
Methods for imaging TF dynamics and subnuclear structures in single cells. (A) Current TF labeling methods (left) and their suitable imaging applications (right). Specifically, three common strategies are schematized: (1) labeling with regular FPs, (2) labeling with photoactivatable/photoswitchable proteins, or (3) self-labeling tags such as HaloTag, SNAPTag, and TMPTag. Self-labeling tags can be conjugated with organic dyes for subsequent imaging applications. FLAP, fluorescence localization after photobleaching (Dunn et al., 2002); PAINT, points accumulation for imaging in nanoscale topography (Sharonov and Hochstrasser, 2006). (B) FRAP technique. A high-intensity–focused laser illumination pulse generates a bleached spot in the cell. The fluorescence recovery curve is the result of dissociation of bleached fluorescent molecules and diffusion-in of unbleached molecules. (C) SMT technique. Left: Sparsely labeled TF molecules appear to be diffraction-limited spots on the camera chip. The position of the TF molecule is determined by localization of the centroid of the spot by Gaussian fitting. The positions of one molecule across multiple frames are linked to form single-molecule trajectories. TF diffusion and binding dynamics can be extracted from single-molecule trajectories. Right: Distinct illumination patterns can be deployed to examine TF diffusion and binding dynamics at different time scales by limiting or using motion blur effect. Specifically, intensive stroboscopic illumination is an efficient way to reduce motion blurring for capturing fast diffusion events, whereas long acquisition times and low laser illumination are used for selectively imaging stable binding events. Long lapse times can also be introduced to reduce photobleaching and to specifically study long-lived binding events up to several minutes. (D) FCS estimates the diffusion dynamics of molecules by recording photon bursting of molecules diffusing through a diffraction-limited focal spot. Fast diffusion gives rise to bursts with shorter temporal widths and vice versa. (E) SMT analysis reveals distinct diffusion dynamics of c-Myc and positive transcription elongation factor (P-TEFb) in live cells. Specifically, c-Myc diffusion is less constrained in space than that of P-TEFb as highlighted by representative single-molecules trajectories (top) and the distribution histograms of the angle formed between the vectors of two consecutive translocation steps (bottom). The data suggest that local protein–protein and protein–DNA interactions alter the diffusion kinetics of P-TEFb molecules. This panel is adapted from Izeddin et al. (2014) with permission. (F) Two-color PALM experiments reveal distinct localization of CTCF (magenta) and the cohesin subunit Rad21 (green) in an interphase cell. Interestingly, CTCF and Rad21 bind to chromatin with different residence times, suggesting their distinct role in establishing chromatin loops in the nucleus. This panel is adapted from Hansen et al. (2017a) with permission. dSTORM, direct STORM.
Figure 2.
Figure 2.
TF binding dynamics at enhancers. (A) TF binding kinetics at cis-regulatory elements is dynamic in live cells. Accumulating evidence suggests that a small group of site-specific TFs act as lead or pioneer binders that efficiently scan and engage with silent chromatin, establishing a permissive chromatin for the subsequent binding of auxiliary TFs, which in turn reinforces an open-chromatin state. TFs bound within the assembly mediate distinct functions (e.g., signal transduction and interplay with core promoter), suggesting a functional division of labor for TFs. (B) The TF temporal occupancy pattern at a specific target site is exquisitely regulated by TF concentration in the nucleus and TF residence times at the target site (left). For this numerical simulation, random TF residence times (R; AU) and sampling intervals (I; AU) were generated based on a log-normal distribution. We set the σ to 1/4 Log(R) or Log(I). The selection of this distribution is based on the observation that the log-scale value of Sox2 residence times on specific DNA probes roughly follows a normal distribution (Chen et al., 2014b). For each pair of mean TF residence times (R) and sampling intervals (I), 1,000 continuous binding events were simulated, and the TF occupancy (color-encoded) of the target site was calculated based on the total binding on/off durations. Representative binding traces of a TF at the target site with defined parameters (1–5) are shown on the right. Blue vertical lines represent TF sampling events. Red horizontal lines reflect TF dwelling events at the target site. (C) The relationship between TF binding dynamics and the functional output of an enhancer. If multiple TFs have an equal ability to bind to the target site and activate gene expression, the functional output of an enhancer should be linearly proportional to integrated TF occupancy at the enhancer. An ordered TF assembly and functional division-of-labor mechanism could potentially generate rapid and nonlinear functional outputs.
Figure 3.
Figure 3.
TF diffusion and binding dynamics. (A) Colocalization of Sox2 enhancer clusters (orange) and Pol II clusters (green) in live cells. Sox2 enhancer clusters were mapped by time-resolved, 2D single-molecule imaging/tracking. Stable binding events (>2 s) are shown. Pol II clusters are mapped by fast imaging acquisition with 100-Hz frame rates. Bar, 2 µm. This panel is adapted from Liu et al. (2014) with permission. (B) Increased Sox2 forward association with chromatin in the nucleus. Two-color single-molecule imaging to probe Sox2 binding and diffusion dynamics in enhancer clusters (EnCs). Enhancer cluster regions were first mapped by the low-excitation, long-acquisition time condition. Then, the diffusion coefficient histogram of tracks within the enhancer cluster regions was calculated and displayed in the below graph. Despite fast diffusion being the dominant fraction in the whole cell, the Sox2 enhancer clusters score elevated TF-bound fractions. This panel is adapted from Liu et al. (2014) with permission. (C) The spatial clustering of cis-regulatory elements in the nucleus of the cell was proposed by several recent imaging-based studies (Liu et al., 2014; Mir et al., 2017; Wollman et al., 2017). (D) The cis-regulatory elements clustering and LCD-mediated weak interactions between TFs would facilitate the TF target search by the mechanisms of protein tethering and intersegment transferring.
Figure 4.
Figure 4.
Pol II clustering and enhancer function. (A) Top: Dynamic RNA Pol II clustering proceeds and predicts transcriptional bursting of β-actin gene. Bottom: Pol II cluster lifetime used as model input (green) is overlaid with a plot of the best fit for the mRNA output (magenta) from theoretical model. A time lag (delay Δt) is observed in the model. The bottom panel is adapted from Cho et al. (2016) with permission. (B) Simultaneous activation of two symmetrically localized genes by a single enhancer. Top: Single sna shadow enhancer driving the expression of the symmetric snaPr-MS2-yellow and snaPr-PP7-yellow reporters. Bottom: Transcription activities for the two reporter genes. The intensity of green (MS2-yellow) and red (PP7-yellow) false coloring is proportional to the signal strength for each transcription focus at a given time. The bottom panel is adapted from Fukaya et al. (2016) with permission. (C) Live-cell imaging data suggest that RNA Pol II functions at the core promoter by rapid assembly and disassembly. RNA Pol II clustering predicts RNA production, suggesting that the clustering is likely involved in transcription initiation processes.

References

    1. Agarwal H., Reisser M., Wortmann C., and Gebhardt J.C.M.. 2017. Direct Observation of Cell-Cycle-Dependent Interactions between CTCF and Chromatin. Biophys. J. 112:2051–2055. 10.1016/j.bpj.2017.04.018 - DOI - PMC - PubMed
    1. Axelrod D., Koppel D.E., Schlessinger J., Elson E., and Webb W.W.. 1976. Mobility measurement by analysis of fluorescence photobleaching recovery kinetics. Biophys. J. 16:1055–1069. 10.1016/S0006-3495(76)85755-4 - DOI - PMC - PubMed
    1. Ball D.A., Mehta G.D., Salomon-Kent R., Mazza D., Morisaki T., Mueller F., McNally J.G., and Karpova T.S.. 2016. Single molecule tracking of Ace1p in Saccharomyces cerevisiae defines a characteristic residence time for non-specific interactions of transcription factors with chromatin. Nucleic Acids Res. 44:e160. - PMC - PubMed
    1. Balzarotti F., Eilers Y., Gwosch K.C., Gynnå A.H., Westphal V., Stefani F.D., Elf J., and Hell S.W.. 2017. Nanometer resolution imaging and tracking of fluorescent molecules with minimal photon fluxes. Science. 355:606–612. 10.1126/science.aak9913 - DOI - PubMed
    1. Barski A., Cuddapah S., Cui K., Roh T.Y., Schones D.E., Wang Z., Wei G., Chepelev I., and Zhao K.. 2007. High-resolution profiling of histone methylations in the human genome. Cell. 129:823–837. 10.1016/j.cell.2007.05.009 - DOI - PubMed

Publication types

Substances