. 2018 Jan 1;32(1):26-41.
doi: 10.1101/gad.309351.117. Epub 2018 Jan 29.

Widespread transcriptional pausing and elongation control at enhancers

Affiliations

Widespread transcriptional pausing and elongation control at enhancers

Telmo Henriques et al. Genes Dev. .

Abstract

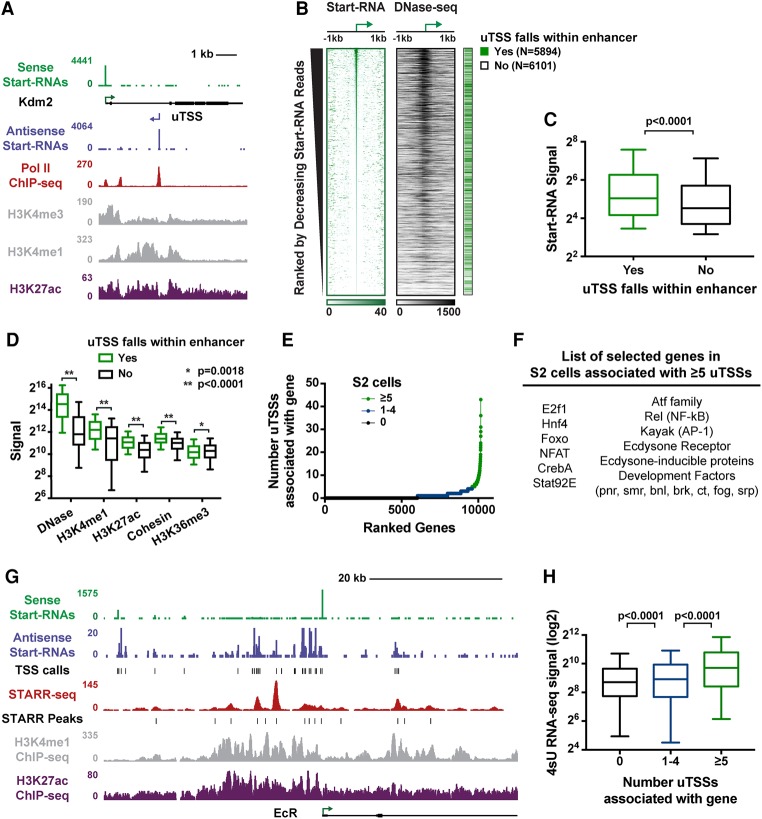
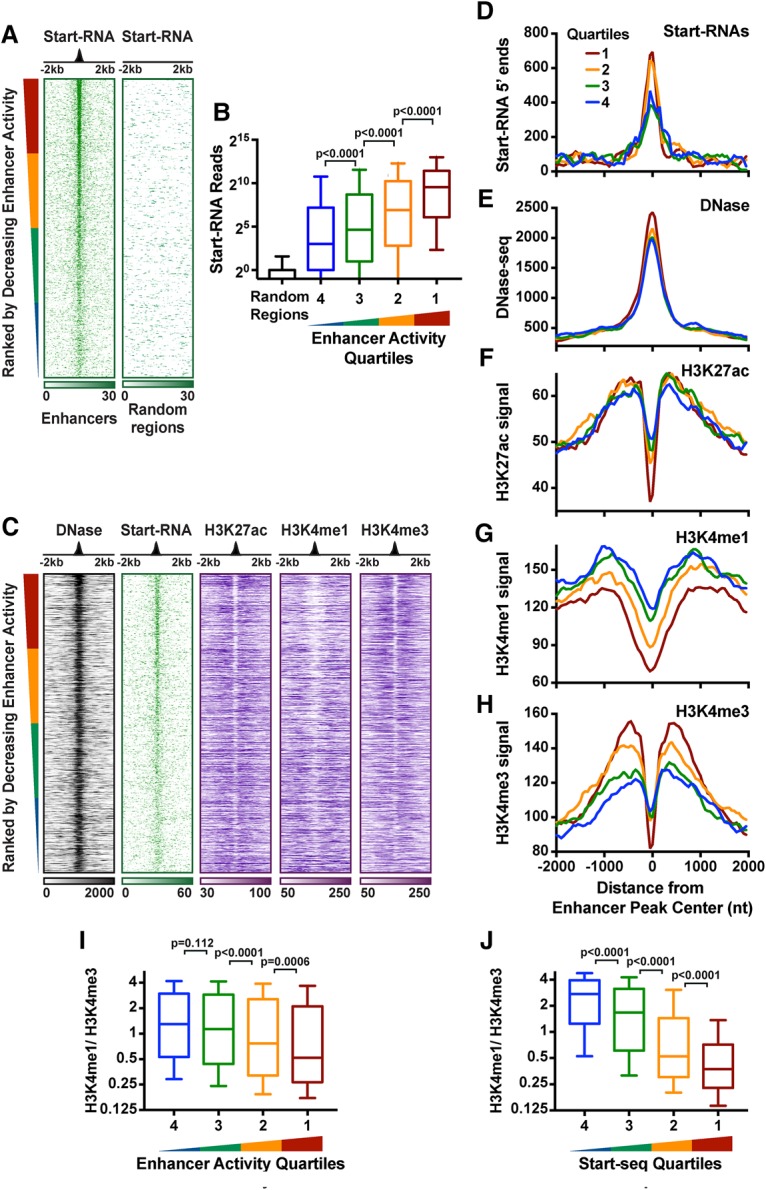
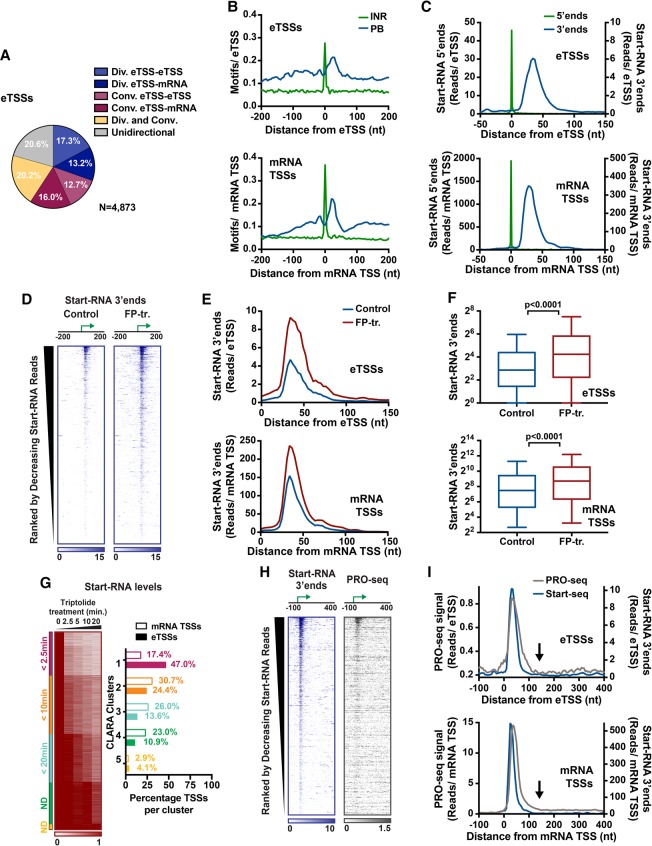
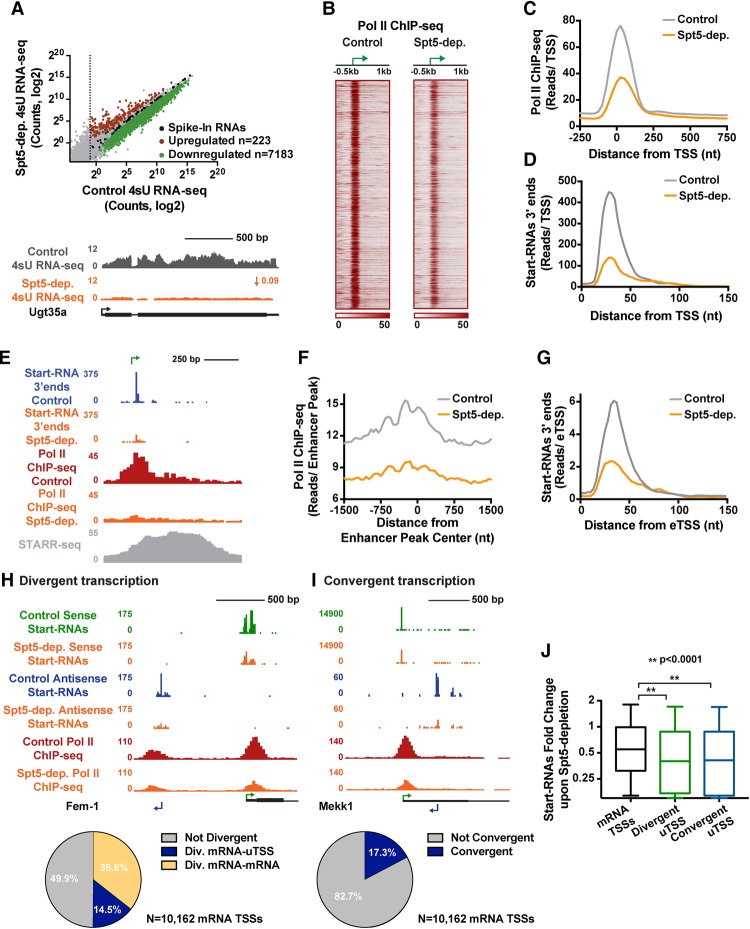
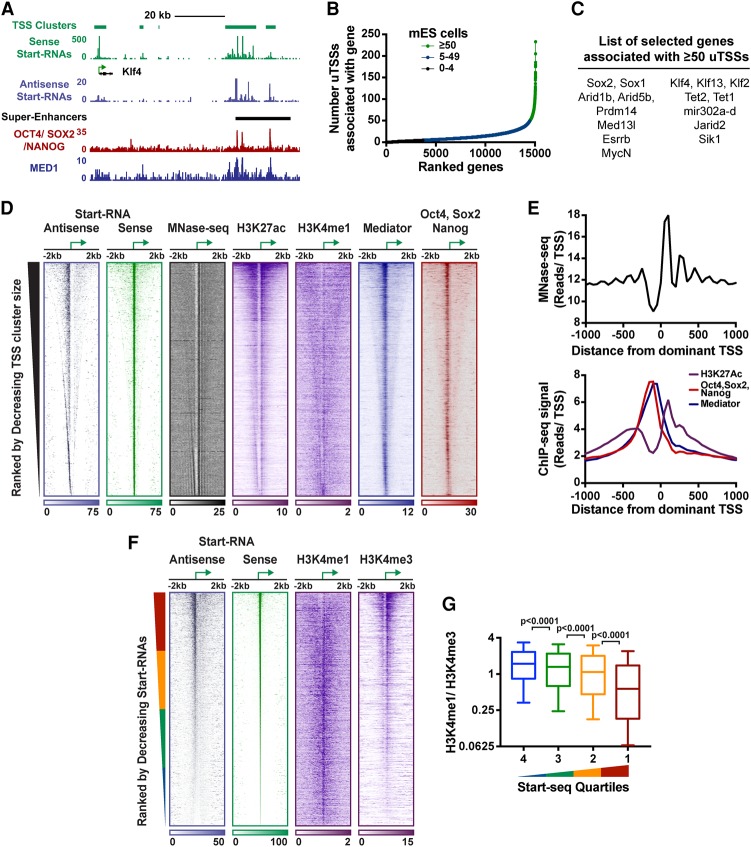
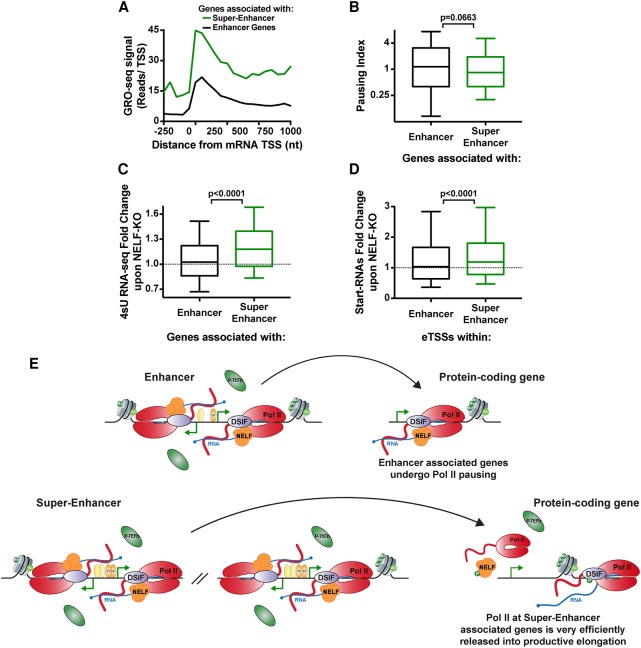
Regulation by gene-distal enhancers is critical for cell type-specific and condition-specific patterns of gene expression. Thus, to understand the basis of gene activity in a given cell type or tissue, we must identify the precise locations of enhancers and functionally characterize their behaviors. Here, we demonstrate that transcription is a nearly universal feature of enhancers in Drosophila and mammalian cells and that nascent RNA sequencing strategies are optimal for identification of both enhancers and superenhancers. We dissect the mechanisms governing enhancer transcription and discover remarkable similarities to transcription at protein-coding genes. We show that RNA polymerase II (RNAPII) undergoes regulated pausing and release at enhancers. However, as compared with mRNA genes, RNAPII at enhancers is less stable and more prone to early termination. Furthermore, we found that the level of histone H3 Lys4 (H3K4) methylation at enhancers corresponds to transcriptional activity such that highly active enhancers display H3K4 trimethylation rather than the H3K4 monomethylation considered a hallmark of enhancers. Finally, our work provides insights into the unique characteristics of superenhancers, which stimulate high-level gene expression through rapid pause release; interestingly, this property renders associated genes resistant to the loss of factors that stabilize paused RNAPII.

Keywords: P-TEFb; Pol II pausing; enhancers; superenhancers; termination; transcription.


Figures

Figure 1.
Figure 1.
Start-RNAs identify regulatory elements with enhancer activity. (A) Start-RNAs (sense Start-RNA [green] and antisense Start-RNA [purple]) as well as RNAPII, H3K4me1, H3K4me3, and H3K27ac ChIP-seq (chromatin immunoprecipitation [ChIP] combined with high-throughput sequencing) profiles are shown around the Kdm2 gene, revealing both annotated TSSs and uTSSs. (B) Start-RNAs and DNase sequencing (DNase-seq) signal at uTSSs, ranked by number of Start-RNA reads (±50 base pairs [bp]). uTSSs that fall within 1 kb of the peak of STARR (self-transcribing active regulatory region) enhancer activity are indicated (green) (Arnold et al. 2013; Zabidi et al. 2015). (C,D) The read density from a number of genomic features is shown at uTSSs within STARR-seq (STARR sequencing) enhancers. P-values are from Mann-Whitney test. (E) Distribution of the number of uTSSs associated with active mRNA genes in S2 cells. A subset of genes has five or more associated uTSSs (n = 568 genes; green). (F) Examples of genes with five or more associated uTSSs. (G) Browser shot of the ecdysone receptor gene (EcR) showing enrichment with Start-RNAs, STARR-seq signal (red), and H3K27ac (purple) and H3K4me1 (gray) histone modifications. (H) 4-thiouridine (4sU) RNA sequencing (RNA-seq) signal is shown for the genes with zero, one to four, and five or more associated uTSSs. P-values are from Kruskal-Wallis test. Box plots show the 25th–75th percentiles, and error bars depict the 10th–90th percentiles. See also Supplemental Figure S1.
Figure 2.
Figure 2.
Start-RNAs are a sensitive readout of enhancer location and activity. (A) 5′ end distributions of Start-RNAs at enhancer regions (n = 11,364; left) and randomly selected genomic regions (right) of the same size. Data are oriented around enhancer peaks and rank-ordered based on enhancer activity. (B) The number of Start-seq reads (±200 bp) is shown at enhancer regions divided into quartiles by activity and at random regions for comparison. Spearman correlation ρ = 0.24. (C) Heat map representations of DNase-seq, Start-RNAs, and H3K27ac, H3K4me1, or H3K4me3 ChIP-seq signal around accessible STARR enhancers that contain an eTSS (a uTSS within an accessible STARR enhancer). n = 3692. Data are oriented and rank-ordered as in A. (DH) Average distributions of Start-RNA 5′ ends (D), DNase-seq (E), H3K27ac (F), H3K4me1 (G), and H3K4me3 (H) histone modifications at sites shown in C. Read counts were summed in 50-nucleotide (nt) bins and centered on the enhancer center peak, and, in D, the moving average across five bins was plotted. (I,J) Ratio of H3K4me1 to H3K4me3 at sites shown in C rank-ordered by enhancer activity (I) or Start-RNA levels (±200 bp) (J). Box plots show the 25th–75th percentiles, and error bars depict the 10th–90th percentiles. P-values are from Kruskal-Wallis test. See also Supplemental Figure S2.
Figure 3.
Figure 3.
eRNA synthesis is regulated during elongation. (A) The percentage of eTSSs that are divergent, convergent, or both with another defined TSS (mRNA or uTSS) within 1 kb. eTSSs without any antisense partners in this window are denoted as unidirectional. (B) Distribution of Initiator (Inr) and pause button (PB) motifs centered on eTSSs (n = 4873; top) and mRNA TSSs (n = 10,162; bottom). (C) The average distribution of 5′ end (green) and 3′ end (blue) Start-RNAs centered on eTSSs and mRNA TSSs. (D) Normalized Start-RNA 3′ end distributions from control or flavopiridol (FP)-treated cells (10 min). Data are centered on eTSSs and rank-ordered by decreasing levels of Start-RNAs (±50 bp). (E,F) The average distribution of Start-RNA 3′ end locations (E) and levels (F) (0–100 bp from the TSS) from control or FP-treated cells. Box plots show the 25th–75th percentiles, and error bars depict the 10th–90th percentiles. P-values are from Mann-Whitney test. (G) Heat map depicting the relative changes in Start-RNAs at eTSSs and mRNA TSSs after triptolide (Trp) inhibition. Data are organized into five clusters (color-coded in the left side bar). n = 1492 eTSSs; n = 8389 mRNA TSSs. The histogram at the right represents the percentage of sites from mRNA TSSs (empty bars) or eTSSs (filled bars) within each cluster. (H, left) 3′ end positions from Start-seq and PRO-seq (precision run-on sequencing) are shown around eTSSs. Data are oriented and ranked as in D. (I) The average distribution of 3′ ends from Start-seq and PRO-seq centered on eTSSs and mRNA TSSs. At eTSSs, note the decrease in PRO-seq signal to background levels ∼150 bp from the TSS (indicated by black arrows). See also Supplemental Figure S3.
Figure 4.
Figure 4.
Elongation factor Spt5 is critical for all RNAPII-dependent transcription. (A, top) 4sU RNA-seq reveals a broad reduction in transcription upon Spt5 depletion. P < 0.001. Fold change > 1.5. (Bottom) Example tracks of a down-regulated gene. (B) Normalized RNAPII ChIP-seq signal (antibody against Rpb3) in control and Spt5-depleted cells. Data are shown around TSSs (depicted as arrows) with significant RNAPII signal in control cells. n = 7733. Genes are rank-ordered randomly. (C) Average RNAPII signal at protein-coding genes upon Spt5 depletion. (D) Average distribution of Start-RNA 3′ ends in control and Spt5-depleted cells at protein-coding promoters. (E) Example enhancer region, with the eTSS position shown as arrow. Spt5 depletion decreases levels of Start-RNA (3′ ends are shown) and RNAPII ChIP-seq signal. (F) Average distribution of RNAPII ChIP-seq signal from control cells and Spt5-depleted cells around active enhancers >2 kb from an obsTSS. n = 1254. (G) Average distribution of Start-RNA 3′ ends from control cells and Spt5-depleted cells around eTSSs. n = 4873. (H,I) Pie chart showing the percentage of TSSs with divergent (H) and convergent (I) transcription antisense to mRNA TSSs. Example genes are shown for each. (J) Start-RNA levels (±50 bp) from control or Spt5-depleted cells centered on mRNA TSSs and uTSSs that are divergent from or convergent with mRNA genes. Box plots show the 25th–75th percentiles, and error bars depict the 10th–90th percentiles. P-values are from Kruskal-Wallis test. See also Supplemental Figure S4.
Figure 5.
Figure 5.
uTSSs pinpoint sites of TF binding within enhancers and superenhancers. (A) Peaks of Start-RNAs near the Klf4 overlap region enriched with master regulators and characterized as a superenhancer. Start-RNAs are shown, along with a combined track of Oct4, Sox2, and Nanog TFs; Mediator; and superenhancer designations from Whyte et al. (2013). (B) The distribution of the number of uTSSs associated (by distance) with the 15,066 genes in mESCs. A subset of genes (n = 583; green) contains ≥50 associated uTSSs. (C) Example genes associated with ≥50 uTSSs (see also Supplemental Table S1). (D) Heat maps depict Start-RNAs in antisense and sense orientation, chromatin accessibility (micrococcal nuclease [MNase]), histone modifications (H3K27ac and H3K4me1), and TF occupancy (Mediator and Oct4, Sox2, and Nanog) centered around the “dominant” TSS in each cluster. n = 32,663. The dominant TSS, shown as an arrow, defines the “sense” strand. Data are rank-ordered by decreasing cluster size. (E) Composite metagene profiles around the dominant TSS of MNase-seq (MNase digestion of chromatin followed by deep sequencing) (top) and H3K27ac, Mediator, and TFs Oct4, Sox2, and Nanog (bottom). (F) Heat map representation of Start-RNAs and H3K4me1 or H3K4me3 ChIP-seq signal around uTSSs. n = 21,763. Data are rank-ordered by decreasing levels of Start-RNAs (±50 bp). (G) Ratio of H3K4me1 to H3K4me3 at uTSSs organized into quartiles by Start-RNA levels (±50 bp). Box plots show the 25th–75th percentiles, and error bars depict the 10th–90th percentiles. P-values are from Kruskal-Wallis test. See also Supplemental Figure S5.
Figure 6.
Figure 6.
Clusters of enhancers facilitate high-level activity and pause release. (A) Average sense strand GRO-seq signal around enhancer-associated (black; n= 4459) and superenhancer-associated (green; n = 231) genes. (B) Comparison of pausing indices among genes associated with enhancers (n = 4459) versus superenhancers (n = 231) (defined in Whyte et al. 2013). (C,D) Fold change in 4sU RNA-seq at genes associated with enhancers or superenhancers (C) and Start-RNA levels at these sites (D) upon deletion of NELF-B. Box plots show the 25th–75th percentiles, and error bars depict the 10th–90th percentiles. P-values are from Mann-Whitney test. (E) Working model. (Top) Genes associated with enhancers or small clusters of uTSSs harbor paused RNAPII. NELF stabilizes pausing at this gene group until P-TEFb is recruited such that the kinetic delay of pausing is offset by increased promoter occupancy of engaged RNAPII. (Bottom) Superenhancers/large clusters of uTSSs maintain a high local concentration of stimulatory factors, including P-TEFb, such that NELF-mediated pausing is not required—and is likely inhibitory—for expression. See also Supplemental Figure S6.

Comment in

References

    1. Adelman K, Lis JT. 2012. Promoter-proximal pausing of RNA polymerase II: emerging roles in metazoans. Nat Rev Genet 13: 720–731. - PMC - PubMed
    1. Andersson R, Gebhard C, Miguel-Escalada I, Hoof I, Bornholdt J, Boyd M, Chen Y, Zhao X, Schmidl C, Suzuki T, et al. 2014. An atlas of active enhancers across human cell types and tissues. Nature 507: 455–461. - PMC - PubMed
    1. Arner E, Daub CO, Vitting-Seerup K, Andersson R, Lilje B, Drabløs F, Lennartsson A, Rönnerblad M, Hrydziuszko O, Vitezic M, et al. 2015. Transcribed enhancers lead waves of coordinated transcription in transitioning mammalian cells. Science 347: 1010–1014. - PMC - PubMed
    1. Arnold CD, Gerlach D, Stelzer C, Boryń ŁM, Rath M, Stark A. 2013. Genome-wide quantitative enhancer activity maps identified by STARR-seq. Science 339: 1074–1077. - PubMed
    1. Austenaa LMI, Barozzi I, Simonatto M, Masella S, Chiara Della G, Ghisletti S, Curina A, de Wit E, Bouwman BAM, de Pretis S, et al. 2015. Transcription of mammalian cis-regulatory elements is restrained by actively enforced early termination. Mol Cell 60: 460–474. - PubMed

Publication types

MeSH terms