. 2018 Jan 1;32(1):42-57.
doi: 10.1101/gad.308619.117. Epub 2018 Jan 29.

The degree of enhancer or promoter activity is reflected by the levels and directionality of eRNA transcription

Affiliations

The degree of enhancer or promoter activity is reflected by the levels and directionality of eRNA transcription

Olga Mikhaylichenko et al. Genes Dev. .

Abstract

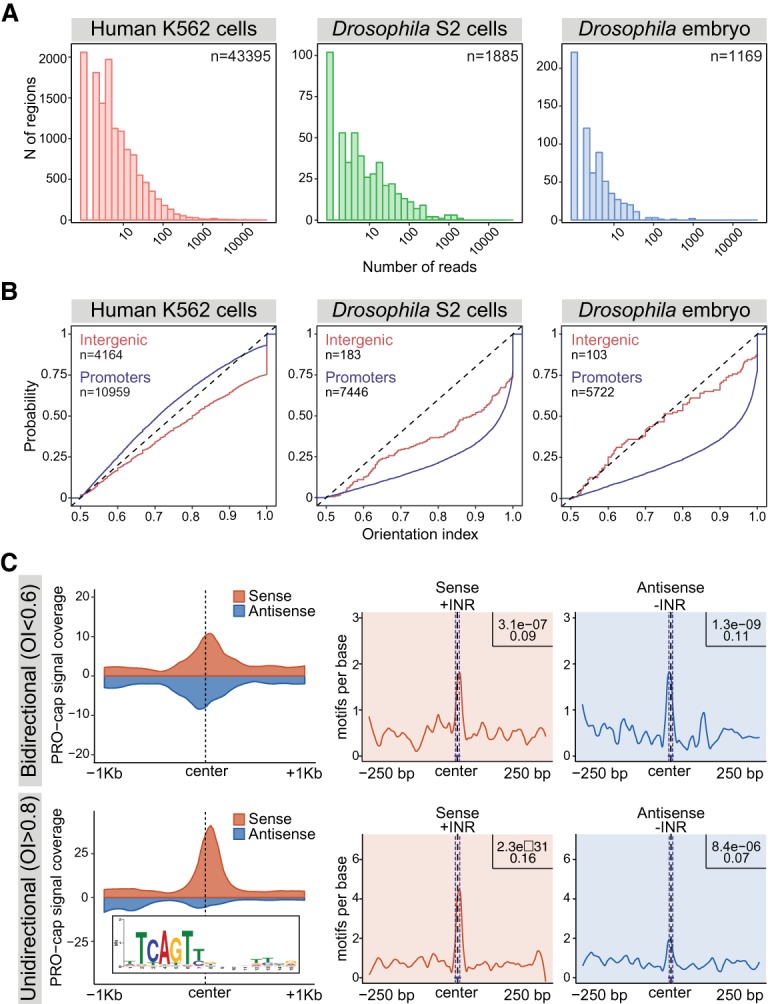
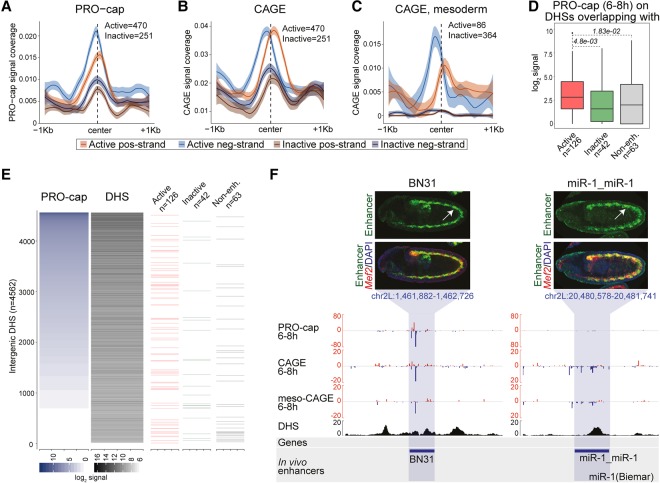
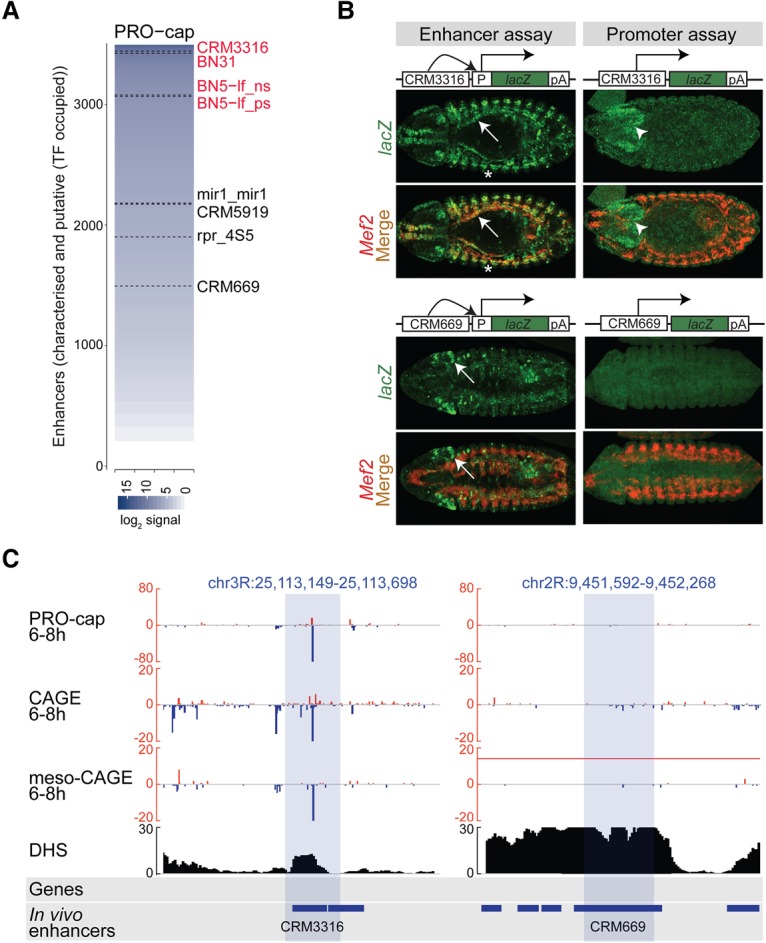
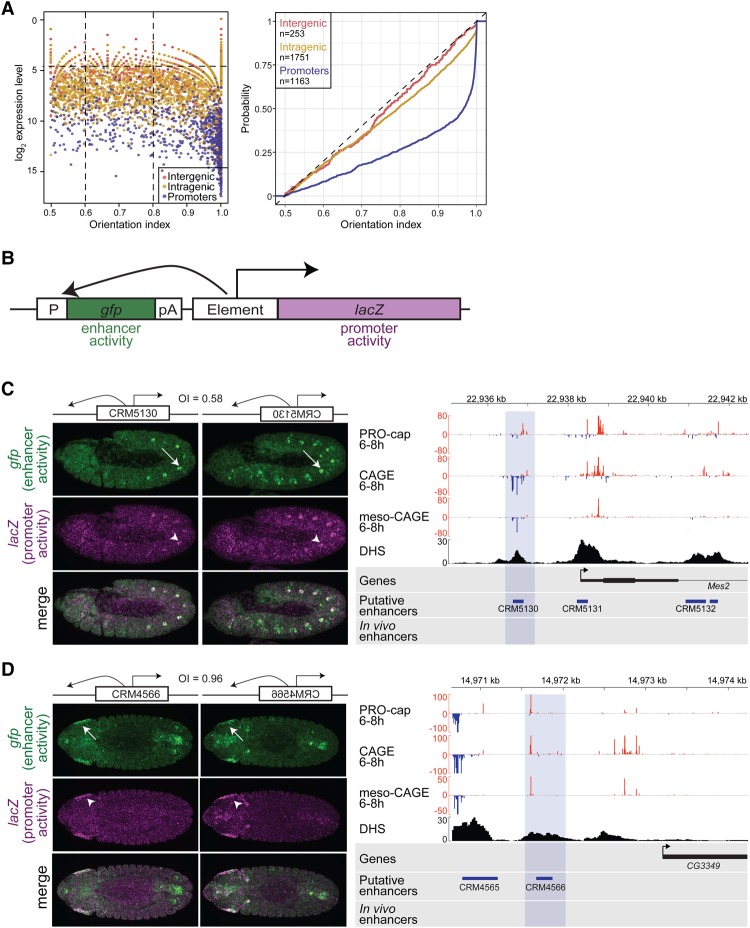
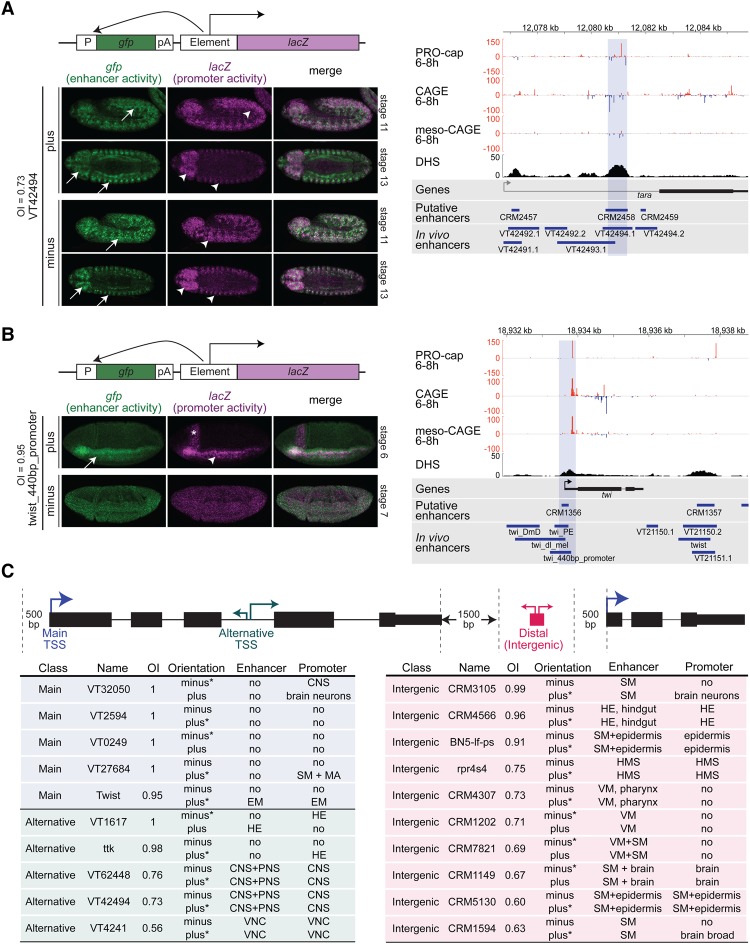
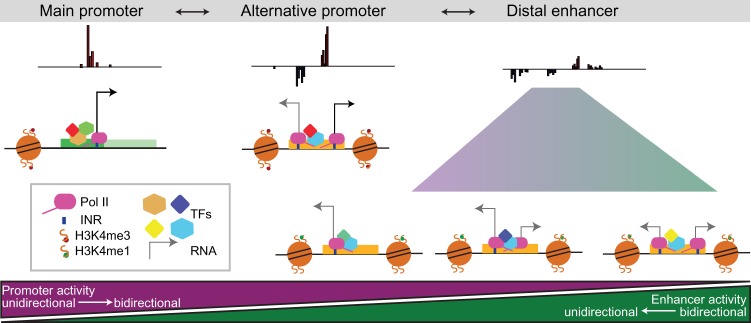
Gene expression is regulated by promoters, which initiate transcription, and enhancers, which control their temporal and spatial activity. However, the discovery that mammalian enhancers also initiate transcription questions the inherent differences between enhancers and promoters. Here, we investigate the transcriptional properties of enhancers during Drosophila embryogenesis using characterized developmental enhancers. We show that while the timing of enhancer transcription is generally correlated with enhancer activity, the levels and directionality of transcription are highly varied among active enhancers. To assess how this impacts function, we developed a dual transgenic assay to simultaneously measure enhancer and promoter activities from a single element in the same embryo. Extensive transgenic analysis revealed a relationship between the direction of endogenous transcription and the ability to function as an enhancer or promoter in vivo, although enhancer RNA (eRNA) production and activity are not always strictly coupled. Some enhancers (mainly bidirectional) can act as weak promoters, producing overlapping spatio-temporal expression. Conversely, bidirectional promoters often act as strong enhancers, while unidirectional promoters generally cannot. The balance between enhancer and promoter activity is generally reflected in the levels and directionality of eRNA transcription and is likely an inherent sequence property of the elements themselves.

Keywords: developmental enhancers; eRNA; embryonic development; ncRNA; promoters; spatio–temporal expression.


Figures

Figure 1.
Figure 1.
General properties of eRNA are similar between Drosophila and vertebrates. (A) Histograms of GRO-cap (human K562 cells [Core et al. 2014]) and PRO-cap (Drosophila S2 cells [Kwak et al. 2013] and Drosophila embryos [6–8 h]) signal at intergenic DHS regions located at least 0.5 and 1.5 kb away from gene 5′ and 3′ ends, respectively. Unannotated TSSs were removed in Drosophila. (B) Cumulative distributions of transcription orientation index (OI) values estimated (using subsampled data from A) over intergenic and promoter DHSs in human K562 cells (Core et al. 2014), Drosophila S2 cells (Kwak et al. 2013), and Drosophila embryos (6–8 h). OI was estimated as the maximum PRO-cap signal (>500 base pairs [bp] around enhancer center) on either DNA strand divided by the sum of signal from both strands, giving a range between 0.5 and 1 (Core et al. 2012). While Drosophila promoters (blue line in S2 cells and embryos) are very directional, intergenic DHSs (yellow lines) have similar bidirectional transcription in both flies and human. (C) Levels of eRNA transcription (PRO-cap; 6–8 h), using loess-smoothed summed reads within intergenic DHSs (Supplemental Table S5) centered on the DHS signal maximum. (Top) Bidirectional (OI ≤ 0.6; n = 456) transcribed intergenic DHSs. (Bottom) Unidirectional (OI ≥ 0.8; n = 696) transcribed intergenic DHSs (putative enhancers). Sense strand (red) is defined as a strand with a higher transcription level. INR enrichment (using the position weight matrix at the bottom left) at the site of maximal transcription initiation in the same regions calculated separately for the sense (red) and antisense (blue) strands. Five-hundred bases around the center are shown; central enrichment and significance were estimated by CentriMo (Bailey and Machanick 2012).
Figure 2.
Figure 2.
eRNA transcription is correlated with developmental enhancer activity. (AC) Levels of eRNA transcription centered on DHSs within characterized developmental enhancers (both intergenic and intragenic) in an active or inactive state. (A,B) PRO-cap and CAGE (Schor et al. 2017) signal from embryos at 6–8 h at enhancers that are active at 6–8 h in any embryonic tissue or inactive at 6–8 h but active at other time points in any tissue. (C) CAGE signal from mesodermal cells (CAGE mesoderm) at 6–8 h at enhancers active in mesoderm at 6–8 h or inactive in mesoderm at 6–8 h but active in other tissues at the same time. (D) Box plots show levels of eRNA transcripiton (log2, PRO-cap) at 6–8 h in intergenic DHSs within active characterized enhancers (red), inactive enhancers at 6–8 h (green), and nonenhancer regions (gray). P-values are from one-sided Wilcoxon rank sum test. (E) Heat map showing ranked eRNA signal (PRO-cap; 6–8 h) and corresponding DHS signal (6–8 h; log2 of the sum of reads per region) over all intergenic DHSs (n = 4562) (Supplemental Table S5). The positions of intergenic enhancers active (126) or inactive (42) at 6–8 h and nonenhancers (63) are shown. (F, top) Transgenic embryos showing in situ hybridization against the lacZ reporter gene (green) and a mesodermal marker (Mef2; red). (Bottom) Genomic regions showing PRO-cap, CAGE, and mesodermal CAGE (meso-CAGE) signal at 6–8 h on positive strand (red), negative strand (blue), and DNase (black) stage 11 (Thomas et al. 2010). The tested enhancer boundaries are indicated by the horizontal blue shading. The BN31 enhancer has relatively high levels of transcription (mainly on the negative strand) compared with miR-1_miR-1.
Figure 3.
Figure 3.
Highly transcribed enhancers can function as promoters in vivo. (A) Ranked PRO-cap 6- to 8-h signal (log2) at characterized and putative enhancers based on mesodermal TF occupancy (Zinzen et al. 2009), both intergenic and intragenic (n = 3492) (Supplemental Table S8). Eight regions tested for enhancer and promoter activities in vivo are indicated with high (red) or low (black) transcription. (B) Double in situ hybridization of transgenic embryos with probes directed against the lacZ reporter gene driven by the tested element (green) and mesoderm marker gene Mef2 (red). (Top panel) CRM3316 acts as an enhancer, driving expression in the somatic (asterisk) and visceral (white arrow) muscle and overlapping Mef2. Expression driven by CRM3316 in the promoter assay is localized to the brain (white arrowhead). Embryos (stage 13) are ventrally oriented with anterior to the left. (Bottom panel) CRM669 acts as an enhancer, driving expression in the head ectoderm (white arrow), but has no detectable activity as a promoter. Embryos (stage 14) are dorsally oriented with anterior to the left. (C) Genomic loci of CRM3316 and CRM669 showing PRO-cap, CAGE, and meso-CAGE (from mesodermal cells sorted by FACS) signal at 6–8 h on both the positive (red) and negative (blue) strands. DHSs at stage 11 (spanning 6–8 h) (from Thomas et al. 2010). Blue shading indicates the boundaries of tested regions.
Figure 4.
Figure 4.
The direction of eRNA trancription is associated with the ability of an enhancer to function as a promoter. (A, left panel) eRNA expression (Y-axis; log2 PRO-cap 6–8 h) and the transcription OI (X-axis) at intergenic (red; n = 253) and intragenic (yellow; n = 1751) enhancers and promoter regions (blue; n = 1163). Enhancers is a combined set of characterized (active at 6–8 h) and putative (bound by at least one mesodermal TF at 6–8 h) enhancers (Supplemental Table S8; Zinzen et al. 2009). The OI was estimated as the maximum PRO-cap signal (>500 bp around enhancer center) on either DNA strand divided by the sum of signal from both strands, giving a range between 0.5 and 1 (Core et al. 2012). (Right panel) The cumulative probability distributions (Y-axis) of OI values (X-axis) calculated for intergenic (red) and intragenic (yellow) enhancer and promoter regions (blue), as in A. To remove outliers, only elements with >30 reads (intergenic, intragenic, and TSS), corresponding to 0.25 quantile (horizontal dashed line in the left panel), are plotted. n = 3167. Intergenic and intragenic enhancers show a bidirectional transcriptional pattern, while promoter regions are more unidirectionally transcribed. (B) Schematic of the dual-reporter vector used to measure enhancer (green) and promoter (magenta) activities simultaneously in the same embryos at the same genomic location. (P) hsp70 minimal promoter; (pA) polyadenylation signal; (element) putative regulatory element inserted into a multiple cloning site. (C,D, left) Double in situ hybridization against gfp driven by the minimal promoter under the control of the inserted element (enhancer activity; green) and the lacZ reporter driven by the inserted element (promoter activity; magenta). (Top) CRM5130 (Zinzen et al. 2009) drives highly overlapping enhancer (white arrow) and promoter (white arrowhead) expression in oenocytes and somatic muscle in both sense and antisense orientations. Embryos (stage 11) are laterally oriented with anterior to the left. (Bottom) CRM4566 (Zinzen et al. 2009) has enhancer activity (green) in the hindgut and head ectoderm (white arrow) and acts as promoter (magenta) in the head ectoderm (white arrowhead) in both orientations. Embryos (stage 13) are laterally oriented with anterior to the left. OIs of endogenous transcription: 0.58 bidirectional and 0.96 unidirecitional. (Right) Genomic loci of CRM5130 and CRM4566, showing PRO-cap, CAGE, and meso-CAGE (from FACS-sorted mesodermal cells) signal at 6–8 h on both the positive (red) and negative (blue) strands. DHSs at stage 11 (spanning 6–8 h) (from Thomas et al. 2010). Blue shading indicates the boundaries of tested regions.
Figure 5.
Figure 5.
Gene promoters can act as developmental enhancers. (A,B) Double in situ hybridization against gfp driven by the minimal promoter under the control of the inserted element (enhancer activity; green) and the lacZ reporter driven by the inserted element (promoter activity; magenta). (A, left) VT42494 (Kvon et al. 2014) drives overlapping enhancer (green) and promoter (magenta) expression in the peripheral nervous system and embryonic brain (white arrows, arrowheads) in sense and antisense orientations. Embryos are laterally (stage 11) or ventrally (stage 13) oriented with anterior to the left. (B, left) The Twist_440 bp_promoter element has overlapping enhancer (green) and promoter (magenta) activity in the presumptive mesoderm (arrows) in the sense (plus) orientation. The asterisk indicates the cephalic furrow. No activity was detected in the other orientation for either the enhancer or the promoter. Embryos are laterally (stage 6 or 7) oriented with anterior to the left. (A,B, right) Genomic loci of VT42494 and Twist_440 bp_promoter showing PRO-cap, CAGE, and meso-CAGE (from FACS-sorted mesodermal cells) signal at 6–8 h on both the positive (red) and negative (blue) strands. DHSs at stage 11 (spaning 6–8 h) (from Thomas et al. 2010). Blue shading indicates the boundaries of tested regions. (C) Summary of the activity of all of the tested elements in the dual transgenic assay. (Orientation) Plus or minus DNA strand; (*) strand with higher endogenous transcription; (enhancer) tissues where enhancer (gfp) activity was detected; (promoter) tissues where promoter (lacZ) activity was detected; (CNS) central nervous system; (SM) somatic muscle; (MA) midgut anlage; (HE) head ectoderm; (PNS) peripheral nervous system; (VNC) ventral nerve cord; (HMS) head maxillary segment; (VM) visceral muscle.
Figure 6.
Figure 6.
A continuum of eRNA directionality and levels reflects cis-regualtory function. Schematic representation of gene promoters, alternative gene promoters, and enhancers showing the heterogeneity of transcription directionality (arrowhead orientation), abundance (arrow height), and stability (arrow thickness) across regulatory elements. Going from left (strict promoters) to right (strict enhancers), the levels and orientation of transcription vary, as do the functional properties of the cis-regulatory elelments, going from highly directional promoters to nondirectional enhancers, with intermediate combinations with dual functionality in between.

Comment in

References

    1. Almada AE, Wu X, Kriz AJ, Burge CB, Sharp PA. 2013. Promoter directionality is controlled by U1 snRNP and polyadenylation signals. Nature 499: 360–363. - PMC - PubMed
    1. Andersson R, Gebhard C, Miguel-Escalada I, Hoof I, Bornholdt J, Boyd M, Chen Y, Zhao X, Schmidl C, Suzuki T, et al. 2014a. An atlas of active enhancers across human cell types and tissues. Nature 507: 455–461. - PMC - PubMed
    1. Andersson R, Refsing Andersen P, Valen E, Core LJ, Bornholdt J, Boyd M, Heick Jensen T, Sandelin A. 2014b. Nuclear stability and transcriptional directionality separate functionally distinct RNA species. Nat Commun 5: 5336. - PubMed
    1. Andersson R, Sandelin A, Danko CG. 2015. A unified architecture of transcriptional regulatory elements. Trends Genet 31: 426–433. - PubMed
    1. Archer TK, Lefebvre P, Wolford RG, Hager GL. 1992. Transcription factor loading on the MMTV promoter: a bimodal mechanism for promoter activation. Science 255: 1573–1576. - PubMed

Publication types

Substances

LinkOut - more resources