. 2018 Feb 13;115(7):1433-1438.
doi: 10.1073/pnas.1713568115. Epub 2018 Jan 29.

Automated monitoring of behavior reveals bursty interaction patterns and rapid spreading dynamics in honeybee social networks

Affiliations

Automated monitoring of behavior reveals bursty interaction patterns and rapid spreading dynamics in honeybee social networks

Tim Gernat et al. Proc Natl Acad Sci U S A. .

Abstract

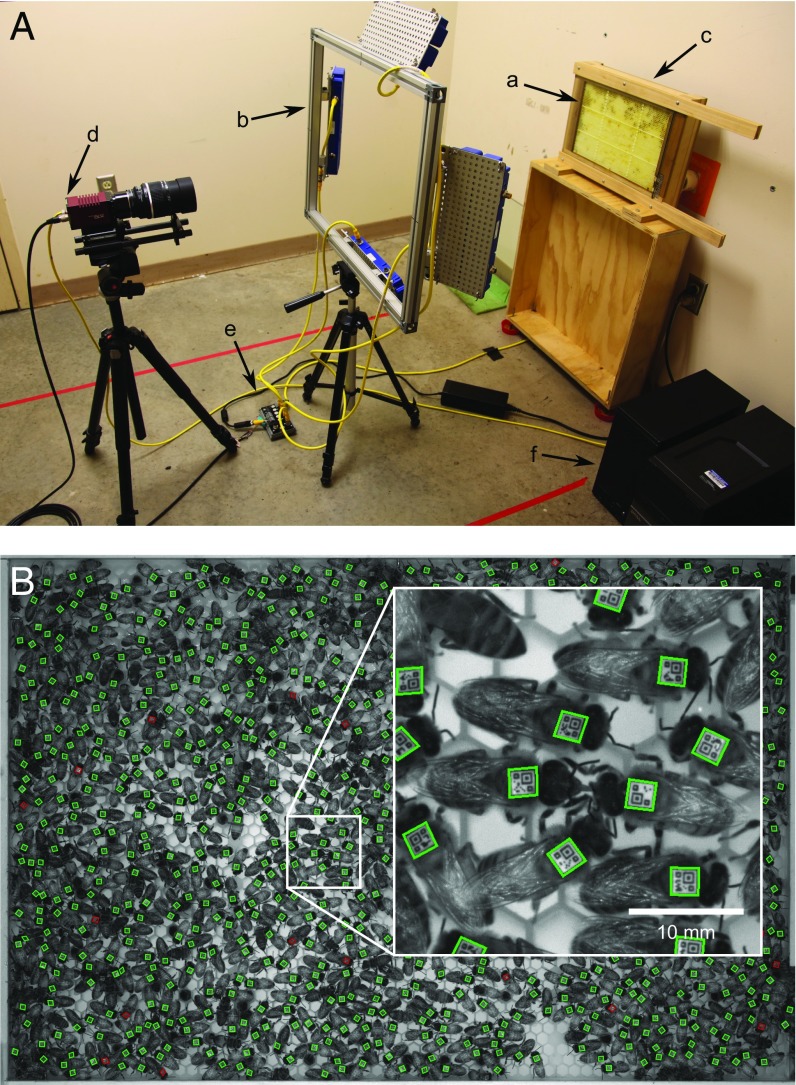
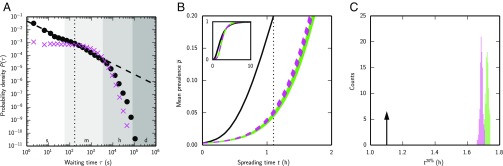
Social networks mediate the spread of information and disease. The dynamics of spreading depends, among other factors, on the distribution of times between successive contacts in the network. Heavy-tailed (bursty) time distributions are characteristic of human communication networks, including face-to-face contacts and electronic communication via mobile phone calls, email, and internet communities. Burstiness has been cited as a possible cause for slow spreading in these networks relative to a randomized reference network. However, it is not known whether burstiness is an epiphenomenon of human-specific patterns of communication. Moreover, theory predicts that fast, bursty communication networks should also exist. Here, we present a high-throughput technology for automated monitoring of social interactions of individual honeybees and the analysis of a rich and detailed dataset consisting of more than 1.2 million interactions in five honeybee colonies. We find that bees, like humans, also interact in bursts but that spreading is significantly faster than in a randomized reference network and remains so even after an experimental demographic perturbation. Thus, while burstiness may be an intrinsic property of social interactions, it does not always inhibit spreading in real-world communication networks. We anticipate that these results will inform future models of large-scale social organization and information and disease transmission, and may impact health management of threatened honeybee populations.

Keywords: barcode; burstiness; temporal network; tracking; trophallaxis.


Conflict of interest statement

The authors declare no conflict of interest.

Figures

Fig. 1.
Fig. 1.
Assay for automatically monitoring social interactions (trophallaxis) in honeybee colonies. (A) Experimental setup. Bees were housed in a glass-walled observation hive (a) that contained a one-sided honeycomb and was connected to a hole in the wall allowing unlimited access to the outdoors for foraging. The hive was illuminated with eight infrared LED lights mounted on an aluminum frame (b). To facilitate automatic image analysis, the honeycomb was backlit with an array of infrared lights mounted behind the hive (c, hidden). Images were recorded with a high-resolution monochrome camera (d) that controlled the infrared lights via a breakout board (e). A standard personal computer (f) controlled the camera and stored images. Some cables are omitted for visual clarity. (B) Typical image obtained from this system, showing barcoded bees inside the observation hive. Outlines reflect whether a barcode could be decoded successfully (green), could not be decoded (red), or was not detected (no outline). The hive entrance is in the lower-right corner. (Inset) Close-up of two bees that were automatically detected performing trophallaxis.
Fig. 2.
Fig. 2.
Illustration of the geometric procedure for detecting potential trophallaxis partners. Dashed squares Ci and Cj are the bCodes of bee i and j, respectively. Each arrow represents the bCode orientation vector that corresponds to the direction a bee is facing. Points Pi and Pj are the most anterior point on the anteroposterior axis of the two bees, and di,j is the distance between these points. If di,j is within a given range and the sum of the angles γi and γj is smaller than a given threshold (i.e., bees i and j are close to and face each other), then we consider bees i and j potential trophallaxis partners.
Fig. 3.
Fig. 3.
Automated confirmation of trophallaxis behavior (see SI Materials and Methods for details). (A) Image of two bees geometrically predicted to be engaged in trophallaxis (Center). (B) Simplified version of the image in A, in which pixel intensities above a threshold value have been set to the threshold value. Note that this procedure removes most of the honeycomb structure and the reflections on the comb contents. Bright colors delineate the area formed by two intersecting half-disks that will be searched for a trophallaxis contact (search area). (C) Result of thresholding the image in B. White areas are considered to be the image background. Black and gray represent the image foreground. Black delineates the trophallaxis search area. (D) Local thickness (45) of the foreground areas in C. Locally thin pixels are drawn with cold colors. These pixels mark image areas that show thin structures like a bee’s proboscis or her antennae. Locally thicker pixels are drawn with increasingly warmer colors. Rich colors highlight the trophallaxis search area. (E) Skeleton of the image in C. The skeleton defines paths that can be traversed to test whether there is a thin structure (green) connecting the front or sides of the fitted head models (magenta). The skeleton underneath the head models was removed to eliminate paths passing through the heads. Rich colors highlight the trophallaxis search area. (F) Front and sides of the fitted head model (magenta) of the two potential trophallaxis partners and a path through a locally thin search area (green) drawn onto the image in A. The path traverses the proboscis (tongue) of the receiving bee.
Fig. 4.
Fig. 4.
Simulated spreading in honeybee trophallaxis networks is faster than in randomized reference networks, despite bursty interaction patterns. Panels show data from trial 1; see Fig. S4 for trials 2–5, which yielded similar results. (A) Distribution of log-binned waiting times between interactions for the empirical network of trial 1 (black circles) and 100 temporally randomized reference networks (magenta crosses). Dashed line: power law fit to the empirical waiting times (see Table 1 for exponents of the fit). The dotted line highlights the threshold W = 168 s that distinguishes short waiting times from long waiting times. Lanes labeled s, m, h, and d denote seconds, minutes, hours, and days, respectively. (B) Mean fraction of bees “infected” via deterministic SI spreading (mean prevalence, controlled for mortality), averaged over 1,000 simulation runs, as a function of spreading time. Solid black line: empirical trophallaxis network; magenta dashed lines: 100 temporally randomized reference networks; green lines: 100 temporally and topologically randomized reference networks; dotted black line: time when the mean prevalence reaches 20% in the empirical network. (Inset) Mean prevalence as a function of spreading time until almost all bees have been “infected.” (C) Histogram of the mean time required to reach 20% prevalence (t20%) for the 100 temporally randomized reference networks (magenta) and the 100 temporally and topologically randomized reference networks (green). Arrow indicates when the prevalence reaches 20% in the empirical network.

References

    1. Conradt L, List C. Group decisions in humans and animals: A survey. Philos Trans R Soc Lond B Biol Sci. 2009;364:719–742. - PMC - PubMed
    1. Charbonneau D, Blonder B, Dornhaus A. 2013. Social insects: A model system for network dynamics. Temporal Networks, Understanding Complex Systems, eds Holme P, Saramäki J (Springer, Berlin), pp 217–244.
    1. Rosenthal SB, Twomey CR, Hartnett AT, Wu HS, Couzin ID. Revealing the hidden networks of interaction in mobile animal groups allows prediction of complex behavioral contagion. Proc Natl Acad Sci USA. 2015;112:4690–4695. - PMC - PubMed
    1. Christakis NA, Fowler JH. The spread of obesity in a large social network over 32 years. N Engl J Med. 2007;357:370–379. - PubMed
    1. Holme P, Saramäki J. Temporal networks. Phys Rep. 2012;519:97–125.

Publication types

LinkOut - more resources