. 2018 Jan 29;8(1):1727.
doi: 10.1038/s41598-018-20132-7.

Automatic Knee Osteoarthritis Diagnosis from Plain Radiographs: A Deep Learning-Based Approach

Affiliations

Automatic Knee Osteoarthritis Diagnosis from Plain Radiographs: A Deep Learning-Based Approach

Aleksei Tiulpin et al. Sci Rep. .

Abstract

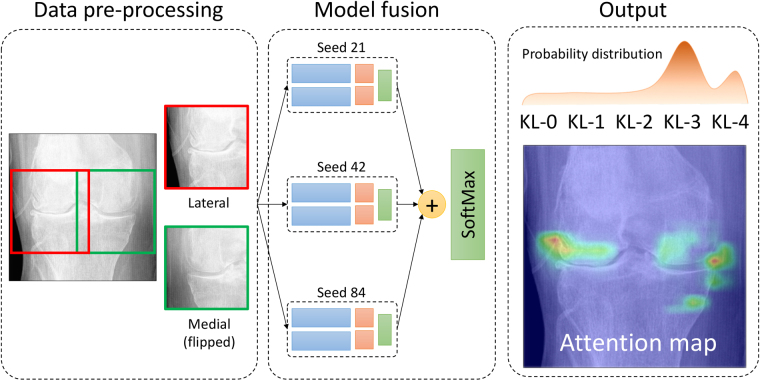
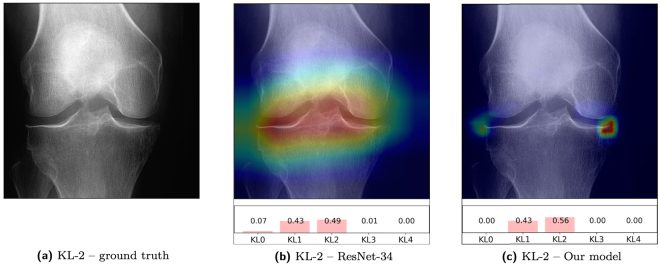
Knee osteoarthritis (OA) is the most common musculoskeletal disorder. OA diagnosis is currently conducted by assessing symptoms and evaluating plain radiographs, but this process suffers from subjectivity. In this study, we present a new transparent computer-aided diagnosis method based on the Deep Siamese Convolutional Neural Network to automatically score knee OA severity according to the Kellgren-Lawrence grading scale. We trained our method using the data solely from the Multicenter Osteoarthritis Study and validated it on randomly selected 3,000 subjects (5,960 knees) from Osteoarthritis Initiative dataset. Our method yielded a quadratic Kappa coefficient of 0.83 and average multiclass accuracy of 66.71% compared to the annotations given by a committee of clinical experts. Here, we also report a radiological OA diagnosis area under the ROC curve of 0.93. Besides this, we present attention maps highlighting the radiological features affecting the network decision. Such information makes the decision process transparent for the practitioner, which builds better trust toward automatic methods. We believe that our model is useful for clinical decision making and for OA research; therefore, we openly release our training codes and the data set created in this study.


Conflict of interest statement

The authors declare that they have no competing interests.

Figures

Figure 1
Figure 1
Proposed classification pipeline. Here, we perform the knee joint area localisation, train three models using different random seeds and eventually fuse together the predictions. After this, we use the softmax layer to normalise the probability distribution and predict the resulting KL grade probability distribution P(y=j|x), j=0,4¯, where x is the given model input. Consequently, we also visualise the attention map, which explains the decision made by the network.
Figure 2
Figure 2
Comparison between common Siamese network and our approach, in which we utilise image symmetry. Light blue rectangles denote the images. In part (a), we show a classic Siamese network application that learns a discriminative image similarity function. In this case, images are fed to the network, and the Euclidean distance is computed afterwards. In part (b), we show a symmetrical image consisting of two parts, which are the inputs for our model. 2(f) indicates the horizontal flipping of the second part. Dark blue boxes denote the shared network branches. The green box labelled as C indicates the concatenation of the outputs from the two network branches.
Figure 3
Figure 3
Schematic representation of the proposed Siamese network’s architecture. First, we took the patches from the lateral and medial sides of the knee joint, horizontally flipping the latter. These patches were the inputs of the two network branches, which consisted of the following blocks having the shared weights (parameters). Blue blocks denote convolution (Conv), batch normalisation (BN) and rectified linear unit (ReLU) layers. Grey circles indicate a max-pooling 2 × 2. Light-red blocks consist of Conv-BN-ReLU layers followed by the global average pooling. The final green block is a softmax layer (classifier) taking a concatenation of the two network branches outputs and predicting KL grade probability distribution over five grades. The numbers inside the Conv-BN-ReLU blocks indicate the number of feature maps (convolutional filters), and the numbers on top of them indicate their parameters K × K, S, where K is a filter size and S is the convolution stride.
Figure 4
Figure 4
(a) Confusion matrix of KL grading and (b) ROC curve for radiographic OA diagnosis KL ≥ 2 produced using our method. Average multi-class accuracy is 66.71%, and AUC value is 0.93. Corresponding Kappa coefficient and MSE value are 0.83 and 0.48, respectively.
Figure 5
Figure 5
Comparison of the attention maps of the correctly classified examples between the baseline and our method. The original image is (a), the attention map produced from the last residual block in the baseline model is (b), and the attention map produced by our model is (c). From the presented example images, the baseline can react to the background noise values or bone texture in classification. Underneath (b,c), we present the predicted probabilities. Attention maps show that our model reacts to the relevant radiological findings – osteophytes – while the baseline reacts to the joint centre.

References

    1. Cross, M. et al. The global burden of hip and knee osteoarthritis: estimates from the global burden of disease 2010 study. Annals rheumatic diseases annrheumdis–2013 (2014). - PubMed
    1. Puig-Junoy, J. & Zamora, A. R. Socio-economic costs of osteoarthritis: A systematic review of cost-of-illness studies. In Seminars in arthritis and rheumatism, vol. 44, 531–541 (Elsevier, 2015). - PubMed
    1. Karsdal M, et al. Disease-modifying treatments for osteoarthritis (dmoads) of the knee and hip: lessons learned from failures and opportunities for the future. Osteoarthr. cartilage. 2016;24:2013–2021. doi: 10.1016/j.joca.2016.07.017. - DOI - PubMed
    1. Finnilä MA, et al. Association between subchondral bone structure and osteoarthritis histopathological grade. J. Orthop. Res. 2017;35:785–792. doi: 10.1002/jor.23312. - DOI - PMC - PubMed
    1. Kellgren J, Lawrence J. Radiological assessment of osteo-arthrosis. Annals rheumatic diseases. 1957;16:494. doi: 10.1136/ard.16.4.494. - DOI - PMC - PubMed

Publication types