. 2018 Jan 29;8(1):1823.
doi: 10.1038/s41598-018-20026-8.

Investigating the origins of eastern Polynesians using genome-wide data from the Leeward Society Isles

Affiliations

Investigating the origins of eastern Polynesians using genome-wide data from the Leeward Society Isles

Georgi Hudjashov et al. Sci Rep. .

Abstract

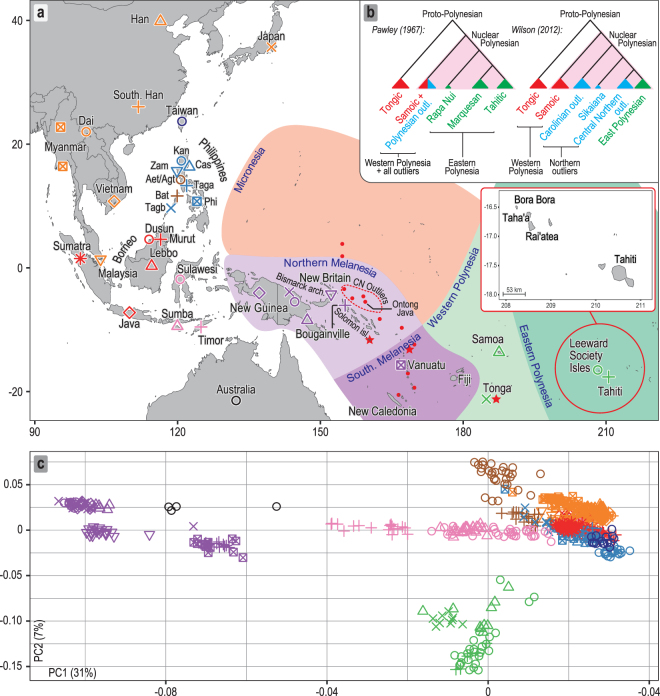
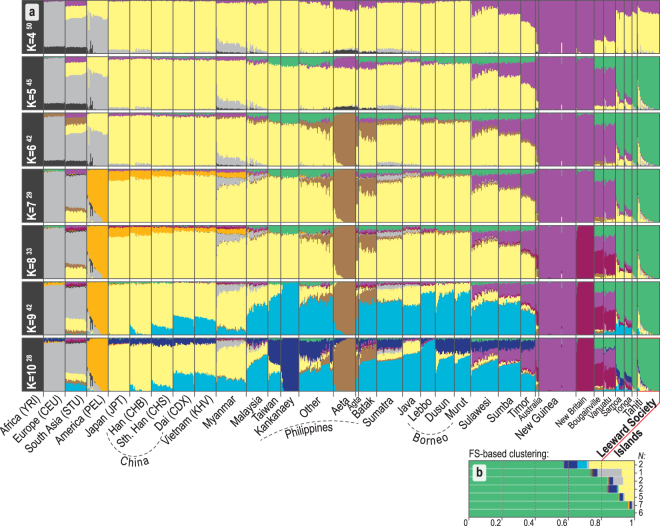
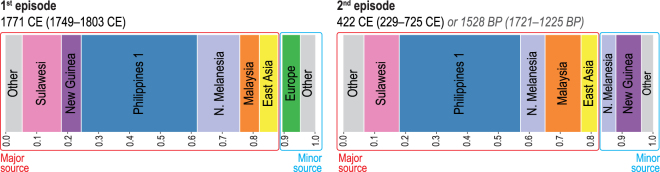
The debate concerning the origin of the Polynesian speaking peoples has been recently reinvigorated by genetic evidence for secondary migrations to western Polynesia from the New Guinea region during the 2nd millennium BP. Using genome-wide autosomal data from the Leeward Society Islands, the ancient cultural hub of eastern Polynesia, we find that the inhabitants' genomes also demonstrate evidence of this episode of admixture, dating to 1,700-1,200 BP. This supports a late settlement chronology for eastern Polynesia, commencing ~1,000 BP, after the internal differentiation of Polynesian society. More than 70% of the autosomal ancestry of Leeward Society Islanders derives from Island Southeast Asia with the lowland populations of the Philippines as the single largest potential source. These long-distance migrants into Polynesia experienced additional admixture with northern Melanesians prior to the secondary migrations of the 2nd millennium BP. Moreover, the genetic diversity of mtDNA and Y chromosome lineages in the Leeward Society Islands is consistent with linguistic evidence for settlement of eastern Polynesia proceeding from the central northern Polynesian outliers in the Solomon Islands. These results stress the complex demographic history of the Leeward Society Islands and challenge phylogenetic models of cultural evolution predicated on eastern Polynesia being settled from Samoa.


Conflict of interest statement

The authors declare that they have no competing interests.

Figures

Figure 1
Figure 1
Sampling locations and overview of genomic diversity. (a) Sources of population data used in the present study. The Philippine group names are abbreviated as follows: Aet (Aeta); Agt (Agta); Bat (Batak); Cas (Casiguran); Kan (Kankanaey); Taga (Tagalog); Tagb (Tagbanua); Zam (Zambales); and Phi (Philippines, incorporating all other groups from this region). Colours indicate regional affiliation of populations used for analysis of autosomal DNA: orange – mainland Southeast Asia and East Asia; dark blue – Taiwan; brown – Philippines Aeta, Agta and Batak negritos; light blue – Philippines non-negritos; red – western Indonesia; pink – eastern Indonesia; purple – northern Melanesia and New Guinea; black – Australia; green –Polynesia. The usage of populations varies with the type of analysis employed (Supplementary Table S1). Inset map shows the three populations from the Leeward Society Isles, and Tahiti, the major island in the Windward Society Isles. The red circles within Micronesia and Melanesia represent 20 of the atolls and islands referred to collectively as outlier Polynesia. The red stars denote the three additional Polynesian outlier populations (Rennell and Bellona, Tikopia), which together with Tonga, were used in analysis of ancient admixture by Skoglund, et al.. Detailed sample information is given in Supplementary Table S1. The map was created using R v. 3.4.1 (R Core Team (2017). R: A language and environment for statistical computing. R Foundation for Statistical Computing, https://www.R-project.org/), and packages ‘maps’ v. 3.2.0 (https://cran.r-project.org/package=maps) and ‘mapdata’ v. 2.2-6 (https://cran.r-project.org/package=mapdata). (b) Inset at top right shows two alternative reconstructed sub-groupings of Polynesian languages discussed in the text. The critical differences are the position of the East Polynesian languages relative to the rest of nuclear Polynesian, and their relationship to the Central Northern Outlier languages. In the sub-grouping according to Pawley all the Polynesian Outlier languages group within Samoic implying an early separation of Proto-East Polynesian from the rest of the Nuclear Polynesian languages. In the alternative sub-grouping proposed by Wilson the Central Northern Outlier languages group with the languages of East Polynesia, within a larger clade containing the other Northern Outlier languages. (c) Principal components analysis of genome-wide SNP diversity in 639 individuals populations shown in panel A; axes are scaled by the proportion of variance described by the corresponding principal component.
Figure 2
Figure 2
Ancestral genomic components in study populations estimated using ADMIXTURE. Details of the populations are provided in Supplementary Table S1B. The colors used have been selected to be equivalent to those used in Fig. 1. Only runs from K = 4 to 10 are shown, complete results (K = 2 to 15) are given in Supplementary Fig. S1. (a) For every value of K, the modal solution with the highest number (superscript) of ADMIXTURE runs is shown; individual ancestry proportions were averaged across all runs and the average cross-validation statistics were calculated across all runs from the same mode (Supplementary Fig. S2). The minimum cross-validation score is observed at K = 11 but no further components appear in the profiles of Polynesians after K = 10. Populations from the Philippines can be generally divided into Negritos (Aeta, Agta and Batak), Kankanaey of northwestern Luzon, and all others representing an amalgamation of groups from Luzon, Palawan and Visayas (see Fig. 1 and Supplementary Table S1B). (b) The average of K = 10 ADMIXTURE profiles for groups of Leeward Society individuals clustered by fineSTRUCTURE (Supplementary Fig. S6), indicating the heterogeneous distribution of East Asian and European ancestry among the Leeward Society Islanders.
Figure 3
Figure 3
Population admixture events and inferred contact dates. Admixture events between genetic clusters obtained using fineSTRUCTURE (FS, Supplementary Fig. S6) and estimated with GLOBETROTTER (GT, Supplementary Table S8) for the Leeward Society Isles group. Each color represents a separate genetic cluster estimated with FS that acts as a donor to the recipient cluster (Leeward Society Isles) in the GT analysis. These donor groups are: Europe, East Asia, Malaysia, northern Melanesia (Bougainville), Philippines (‘Philippine 1’ cluster in FS), New Guinea and Sulawesi. ‘Other’ represents an amalgamation of groups contributing less than 3% ancestry to the admixture episodes in the genomes of Leeward Society Islanders. There is strong statistical support for two episodes of admixture; the ancient and recent events are represented by the left- and right-hand bar plots, respectively. Each episode involves two pairs of sources (minor and major); bar plots depict the inferred composition of the mixing sources for each, with admixture dates calculated using a generation time of 28 years. The dates for the older episode are given in the format of Common Era (CE) and Before Present (BP) for convenience. Detailed information about the inferred admixture episodes and composition of mixing sources is given in Supplementary Table S8.

References

    1. Forster, J. R. Observations made during a voyage round the world, on physical geography, natural history, and ethic philosophy. Especially on: 1. The earth and its strata; 2. Water and the ocean; 3. The atmosphere; 4. The changes of the globe; 5. Organic bodies; and 6. The human species. (Printed for G. Robinson, 1778).
    1. Denham T, Ramsey CB, Specht J. Dating the appearance of Lapita pottery in the Bismarck Archipelago and its dispersal to Remote Oceania. Archaeology in Oceania. 2012;47:39–46. doi: 10.1002/j.1834-4453.2012.tb00113.x. - DOI
    1. Sheppard PJ. Lapita Colonization across the Near/Remote Oceania Boundary. Curr Anthropol. 2011;52:799–840. doi: 10.1086/662201. - DOI
    1. Burley D, Edinborough K, Weisler M, Zhao JX. Bayesian modeling and chronological precision for Polynesian settlement of Tonga. PLoS One. 2015;10:e0120795. doi: 10.1371/journal.pone.0120795. - DOI - PMC - PubMed
    1. Blust, R. A. The Austronesian languages. (Pacific Linguistics, Research School of Pacific and Asian Studies, Australian National University, 2009).

Publication types

Substances

LinkOut - more resources