. 2018 Jan 29;8(1):1826.
doi: 10.1038/s41598-018-20197-4.

Aryl hydrocarbon receptor signaling modulates antiviral immune responses: ligand metabolism rather than chemical source is the stronger predictor of outcome

Affiliations

Aryl hydrocarbon receptor signaling modulates antiviral immune responses: ligand metabolism rather than chemical source is the stronger predictor of outcome

Lisbeth A Boule et al. Sci Rep. .

Abstract

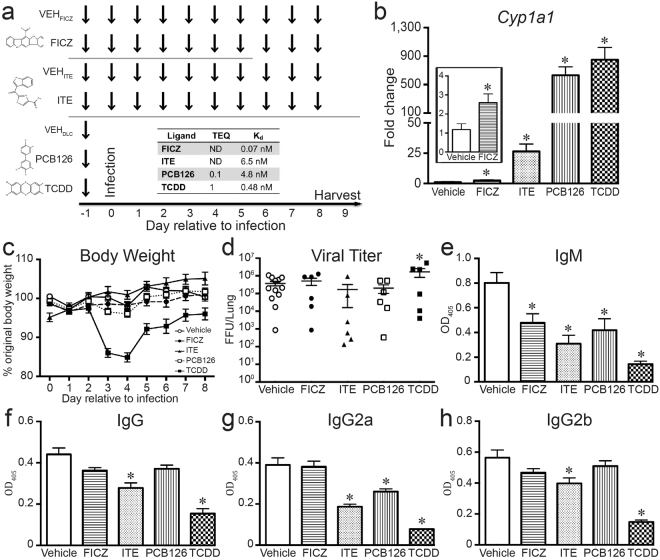
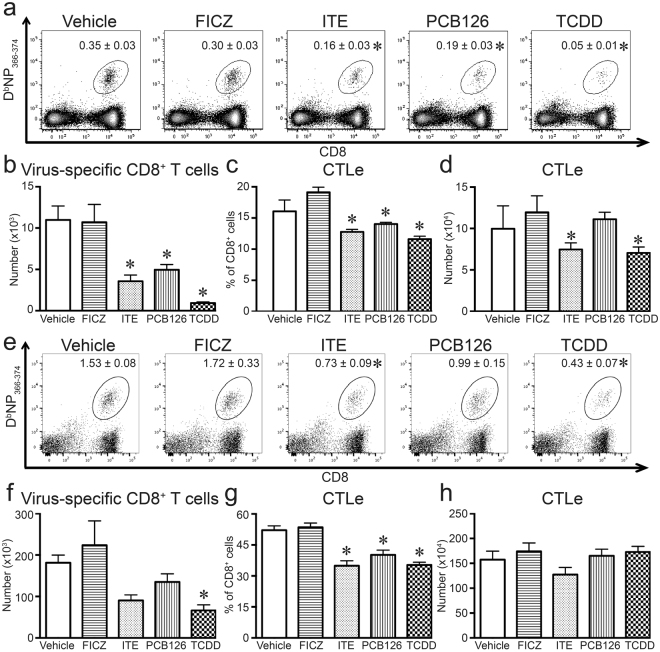
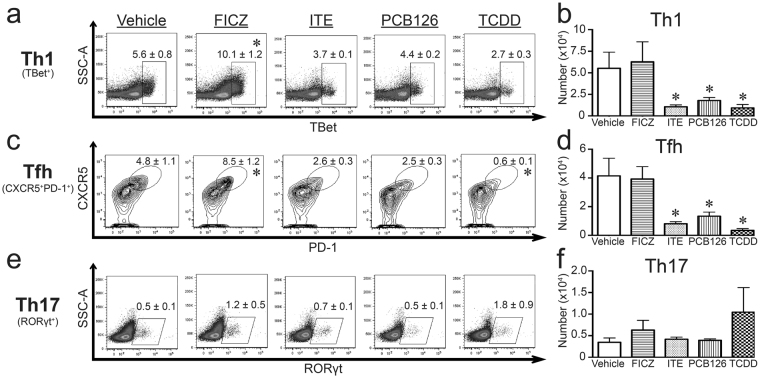
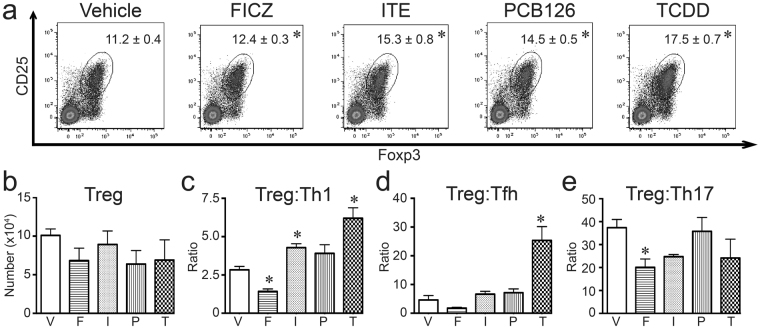
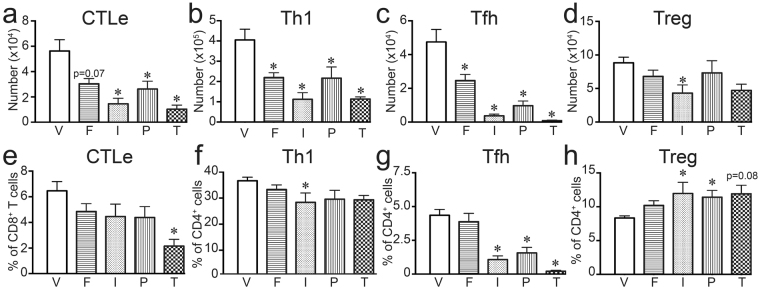
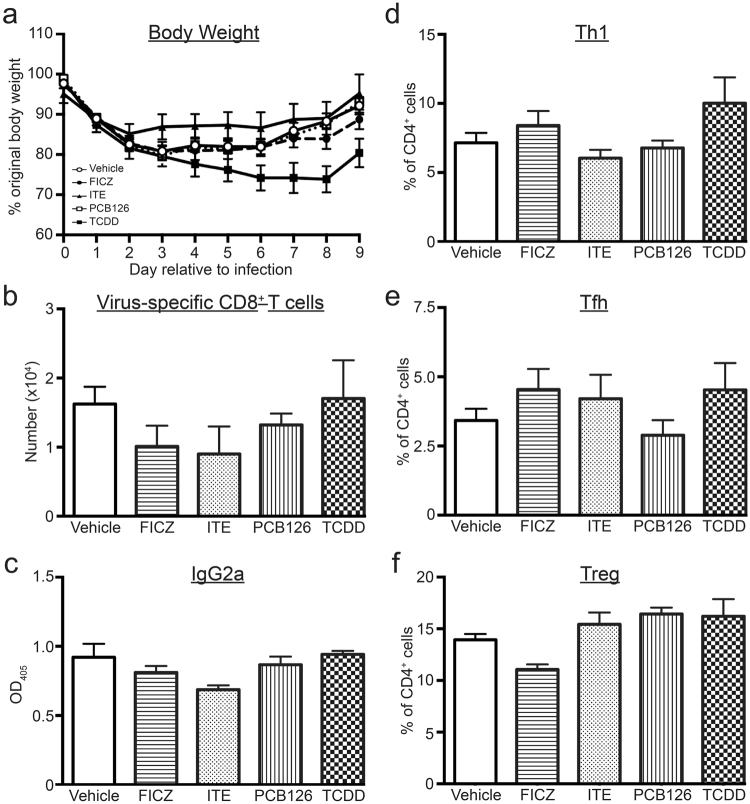
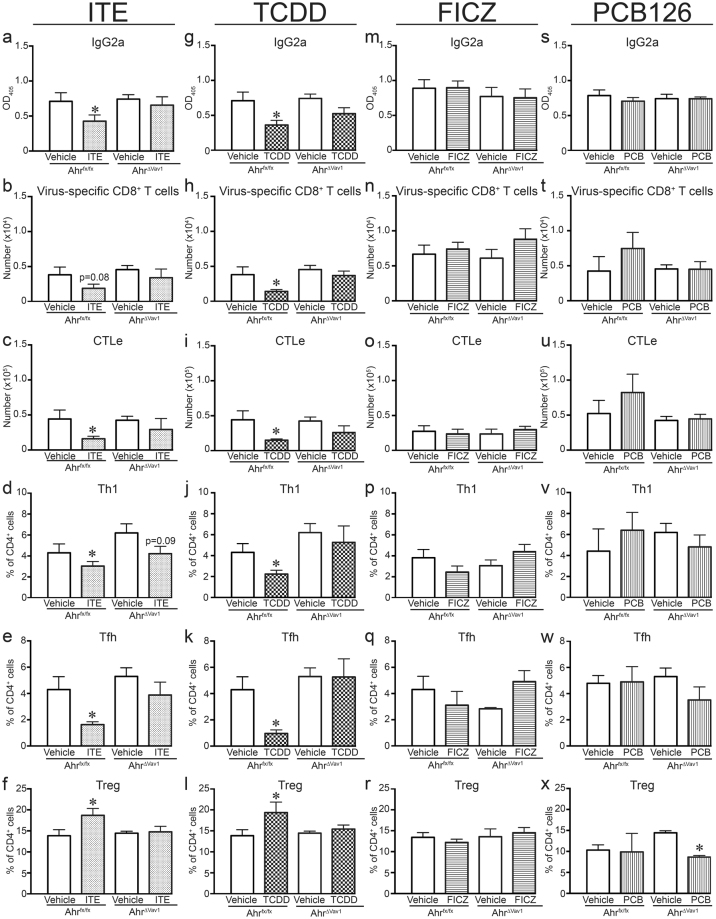
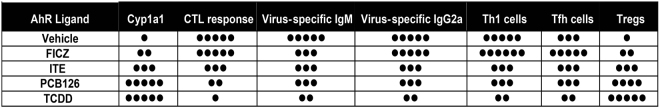
The aryl hydrocarbon receptor (AHR) offers a compelling target to modulate the immune system. AHR agonists alter adaptive immune responses, but the consequences differ across studies. We report here the comparison of four agents representing different sources of AHR ligands in mice infected with influenza A virus (IAV): TCDD, prototype exogenous AHR agonist; PCB126, pollutant with documented human exposure; ITE, novel pharmaceutical; and FICZ, degradation product of tryptophan. All four compounds diminished virus-specific IgM levels and increased the proportion of regulatory T cells. TCDD, PCB126 and ITE, but not FICZ, reduced virus-specific IgG levels and CD8+ T cell responses. Similarly, ITE, PCB126, and TCDD reduced Th1 and Tfh cells, whereas FICZ increased their frequency. In Cyp1a1-deficient mice, all compounds, including FICZ, reduced the response to IAV. Conditional Ahr knockout mice revealed that all four compounds require AHR within hematopoietic cells. Thus, differences in the immune response to IAV likely reflect variances in quality, magnitude, and duration of AHR signaling. This indicates that binding affinity and metabolism may be stronger predictors of immune effects than a compound's source of origin, and that harnessing AHR will require finding a balance between dampening immune-mediated pathologies and maintaining sufficient host defenses against infection.


Conflict of interest statement

The authors declare that they have no competing interests.

Figures

Figure 1
Figure 1
In vivo administration activates AHR. (a) Dosing strategy: arrows depict when female C57Bl/6 mice were treated with each compound. The indicated times are relative to intranasal (i.n.) infection with IAV, which is denoted as day 0. TCDD (10 μg/kg BW) and PCB126 (100 μg/kg BW) were administered orally once, one day before infection. FICZ (100 μg/kg BW daily) was also administered by gavage, whereas ITE (10 mg/kg BW daily) was given intraperitoneally (i.p.). Structures for each compound are shown to the left of the dosing strategy (www.chemspider.com). Control mice received the appropriate vehicle following the same treatment route and dosing schedule: VEHFICZ, VEHITE, VEHDLC. The response of all vehicle treatment groups to infection was not different; therefore, a single representative vehicle group is shown in all figures. (b) RNA was isolated and RT-qPCR was performed to measure Cyp1a1 levels. The graph depicts the mean expression of Cyp1a1 levels in liver. The inset graph shows an enlargement of data comparing FICZ and vehicle treated mice. (c) The graph depicts the percent body weight change relative to the day prior to infection for mice in all treatment groups. (d) The pulmonary viral burden was measured 2 days after infection. The viral FFU per lung was determined by incubating lung homogenates on MDCK cells. Each symbol represents FFU/lung from a different mouse, and the horizontal line denotes the mean FFU for each treatment group. (eh) Anti-influenza virus antibody ELISAs were performed using a dilution series of serum. The graphs show the mean level of circulating virus-specific (e) IgM (f) IgG, (g) IgG2a and (h) IgG2b in each group at the same serum dilution (1:6400). 5–8 mice were used per treatment group, and an * indicates a p value ≤ 0.05 as compared to appropriate vehicle control. All data are presented as the mean ± SEM. All experiments have been independently repeated at least once with similar results.
Figure 2
Figure 2
Virus-specific and cytotoxic CD8+ T cells are reduced by some AHR ligands. Mice were treated and infected as in Fig. 1. On day 9 post infection, MLN and lung derived immune cells were collected from the mice and stained for flow cytometry. (a) Representative dot plots depict DbNP366–375+CD8+ T cells in the MLN. The number on each plot is the mean percentage of CD8+ T cells labeled with DbNP366–375. (b) The graph shows the average number of DbNP366–375+CD8+ T cells in the MLN. (c,d) The bar graphs depict the (c) percentage and (d) number of cytotoxic effector cytotoxic T lymphocytes (CTLe) in the MLN, defined as CD44hiCD62LloCD8+ T cells. (e) Representative dot plots depict DbNP366–375+CD8+ T cells in the lung. The number on each plot is the mean percentage of CD8+ T cells labeled with DbNP366–375. (f) The graph shows the average number of DbNP366–375+CD8+ T cells in the lung. (g,h) The bar graphs depict the (g) percentage and (h) number of cytotoxic CTLe in the lung. 5–8 mice per treatment group were used, and data are shown as the mean ± SEM. An * indicates p ≤ 0.05 compared to vehicle, and all experiments have been independently repeated at least one time with similar results.
Figure 3
Figure 3
AHR ligand treatment alters conventional CD4+ T cell responses during infection in a ligand-specific manner. Mice were exposed and infected as described in Fig. 1. MLNs were harvested 9 days after infection, and cells were stained for flow cytometry. (a,c,e) Representative plots with mean percentage (± SEM) of CD4+ T cells that are (a) Th1 cells (TBet+CD4+, gated on CD4+ cells), (c) Tfh cells (CD44hiCXCR5+PD-1+CD4+, gated on CD44hiCD4+ cells), and (e) Th17 cells (RORγt+CD4+; gated on CD4+ cells). (b,d,f) The graphs show number (± SEM) of (b) Th1 cells, (d) Tfh cells, and (f) Th17 cells. 5–8 mice were used per group, and an * indicates a p value ≤ 0.05 compared to vehicle control. All experiments have been independently repeated at least once and yielded similar results.
Figure 4
Figure 4
All four AHR ligands increase the frequency of Tregs during infection. Mice were exposed and infected as described in Fig. 1. MLN were harvested 9 days after infection, and cells were stained for flow cytometry. (a) Representative plots with mean percentage (± SEM) of Tregs (Foxp3+CD25+CD4+ cells; gated on CD4+ cells) are shown. (b) The graph shows the average number of Tregs in each group. (ce) The graphs show ratio of (c) Treg:Th1 cells, (d) Treg:Tfh cells, and (e) Treg:Th17 cells. 5–8 mice were used per group, and an * indicates a p value ≤ 0.05 compared to vehicle control. Groups are designated as follows: V, vehicle control; F, FICZ; I, ITE; P, PCB126; T, TCDD. All experiments have been independently performed at least once, and the results were similar.
Figure 5
Figure 5
Reducing ligand metabolism results in all four compounds having similar effects. Cyp1a1−/− mice (6–8 weeks of age) were treated with each compound or vehicle control, and infected with IAV using the same doses and timing outlined in Fig. 1. MLN cells were collected and stained for flow cytometry 7 days after infection. T cell populations were defined as in Figs 2–4. (ad) The graphs depict the mean number (±SEM) of (a) CTLe, (b) Th1 cells, (c) Tfh cells, and (d) Tregs. (e,f) The graphs show the average percentage (±SEM) of (e) CTLe (of total CD8+ T cells) (f) Th1 cells (of total CD4+ T cells), (g) Tfh cells (of total CD4+ T cells), and (h) Tregs (of total CD4+ T cells). Groups are labeled as V, vehicle control; F, FICZ; I, ITE; P, PCB126; and T, TCDD. 4–8 mice were used per group, and an * indicates a p value ≤ 0.05 compared to the vehicle control group.
Figure 6
Figure 6
AHR mediates the effects of all four ligands on T cell and antibody responses to infection. Age-matched and sex-matched Ahr−/− mice were treated with AHR ligands and infected with IAV, as in Fig. 1. MLN and serum were harvested on day 9 post infection, and MLN cells were stained for flow cytometry. T cell subsets were defined as in Figs 2–4, and virus-specific IgG levels were measured by ELISA. Graphs depict the (a) the percent body weight change relative to the day prior to infection for mice in all treatment groups, (b) number of virus-specific (DbNP366–374+) CD8+ T cells, (c) the relative amount of circulating anti-influenza IgG2a, (d) the percentage of TBet+CD4+ (Th1) cells, (e) the percentage of CD44hiCXCR5+PD-1+ CD4+ (Tfh) cells, and (f) percentage of Tregs (Foxp3+CD25+CD4+). 5–8 mice were used per treatment group. All data are shown ± SEM.
Figure 7
Figure 7
AHR in hematopoietic cells is necessary for changes in adaptive immune responses to IAV. AhrΔVav1 and Ahrfx/fx mice were treated with AHR ligands and infected on day 0 as indicated in Fig. 1, except the doses were raised as follows: 1000 μg FICZ /kg BW, 1000 μg PCB126/kg BW, or 100 μg TCDD/kg BW. Daily treatment with ITE remained at 10 mg/kg BW. MLN and serum were collected 9 days after infection. CD4 and CD8 T cell subsets were defined using flow cytometry, and virus-specific antibody levels measured using ELISA. Row 1: Graphs a,g,m,s depict the relative level of circulating anti-influenza IgG2a. Row 2 (graphs b,h,n,t) shows the number of virus-specific (DbNP366–374+) CD8+ T cells, and Row 3 (graphs c,i,o,u) indicates the number of CTLe. Rows 4–6 show the percentage of Th1 cells (TBet+CD4+ T cells; graphs d,j,p,v), Tfh cells (CD44hiCXCR5+D-1+ CD4+ T cells; graphs e,k,q,w), and Tregs (Foxp3+CD25+CD4+; graphs f,l,r,x) in Ahrfxfx and AhrVav1 mice treated with each compound. 5–8 mice per group were used for each experiment, and all data shown are ± SEM. An *indicates a p value ≤ 0.05 compared to vehicle control within each genotype.
Figure 8
Figure 8
Summary of immune modulation during acute primary IAV infection. Exposure to each of these compounds modulates aspects of the adaptive immune response to IAV infection, although the magnitude, and sometimes direction of change, is ligand and cell type-specific. The number of dots represents the relative magnitude of the change in the indicated metric compared to infected vehicle-treated controls.

References

    1. Quintana FJ, et al. Control of Treg and TH17 cell differentiation by the aryl hydrocarbon receptor. Nature. 2008;453:65–71. doi: 10.1038/nature06880. - DOI - PubMed
    1. Veldhoen M, et al. The aryl hydrocarbon receptor links TH17-cell-mediated autoimmunity to environmental toxins. Nature. 2008;453:106–109. doi: 10.1038/nature06881. - DOI - PubMed
    1. Kerkvliet NI, et al. Activaiton of aryl hydrocarbon receptor by TCDD prevents diabetes in NOD mice and increases Foxp3+ T cells in pancreatic lymph nodes. Immunotherapy. 2009;1:539–547. - PMC - PubMed
    1. Quintana FJ, et al. An endogenous aryl hydrocarbon receptor ligand acts on dendritic cells and T cells to suppress experimental autoimmune encephalomyelitis. Proc Natl Acad Sci USA. 2010;107:20768–20773. doi: 10.1073/pnas.1009201107. - DOI - PMC - PubMed
    1. Ehrlich A, et al. Activation of the Aryl Hydrocarbon Receptor by 10-Cl-BBQ Prevents Insulitis and Effector T Cell Development Independently of Foxp3+ Regulatory T Cells in Nonobese Diabetic Mice. J. Immunol. 2016;196:264–273. doi: 10.4049/jimmunol.1501789. - DOI - PMC - PubMed

Publication types

MeSH terms