. 2018 Mar;20(3):252-261.
doi: 10.1038/s41556-017-0028-5. Epub 2018 Jan 29.

Local control of intracellular microtubule dynamics by EB1 photodissociation

Affiliations

Local control of intracellular microtubule dynamics by EB1 photodissociation

Jeffrey van Haren et al. Nat Cell Biol. 2018 Mar.

Abstract

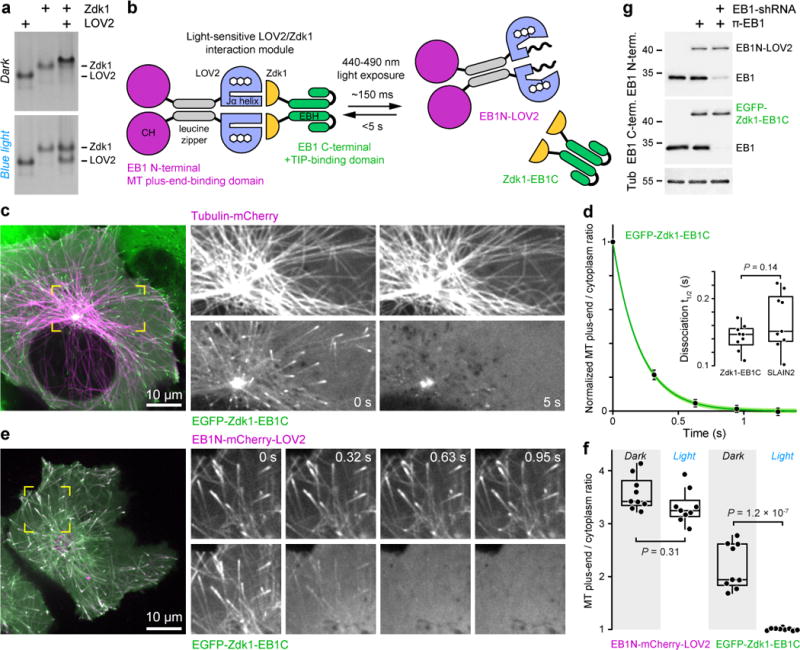
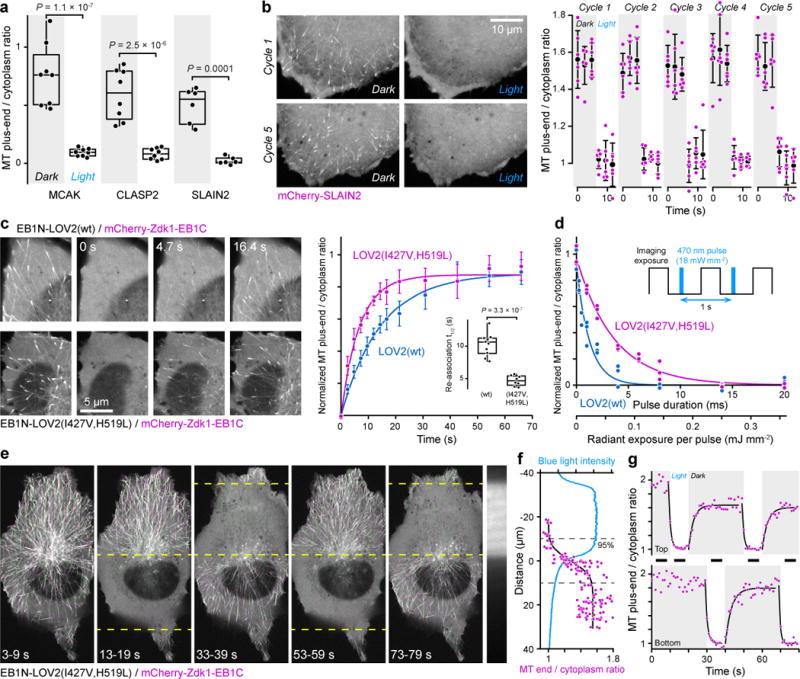
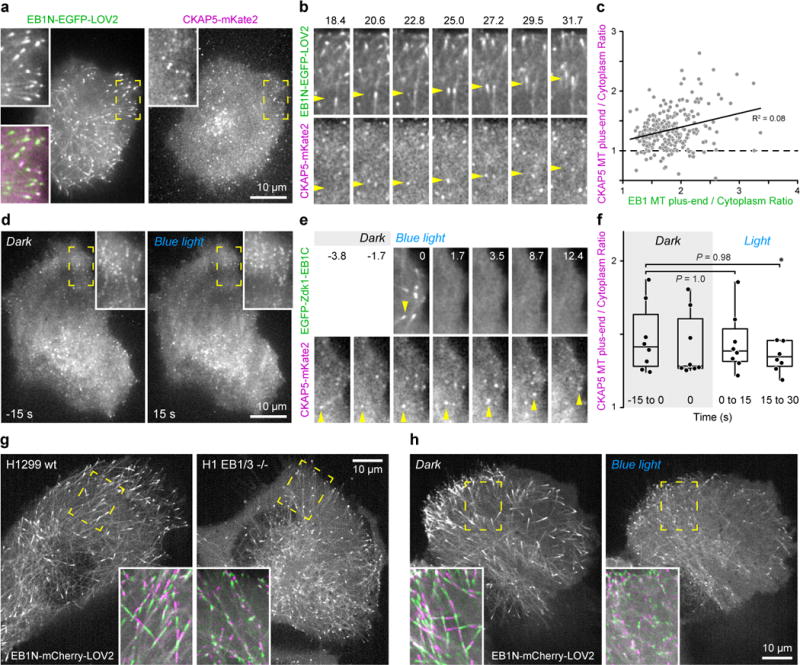
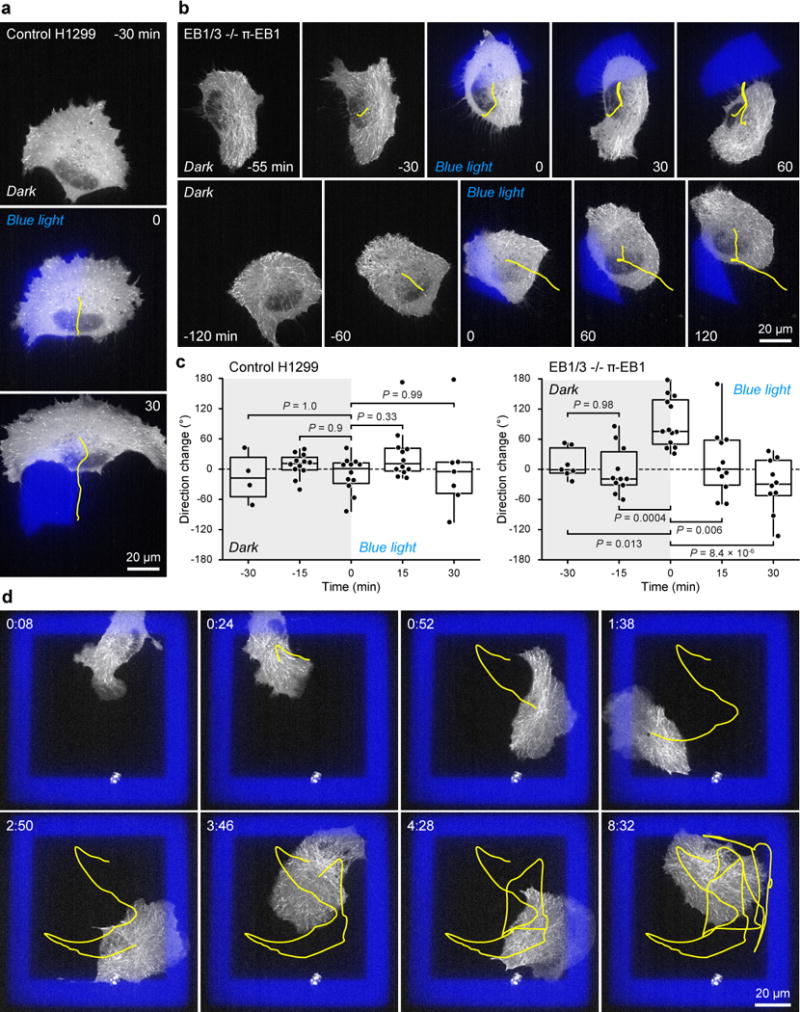
End-binding proteins (EBs) are adaptors that recruit functionally diverse microtubule plus-end-tracking proteins (+TIPs) to growing microtubule plus ends. To test with high spatial and temporal accuracy how, when and where +TIP complexes contribute to dynamic cell biology, we developed a photo-inactivated EB1 variant (π-EB1) by inserting a blue-light-sensitive protein-protein interaction module between the microtubule-binding and +TIP-binding domains of EB1. π-EB1 replaces endogenous EB1 function in the absence of blue light. By contrast, blue-light-mediated π-EB1 photodissociation results in rapid +TIP complex disassembly, and acutely and reversibly attenuates microtubule growth independent of microtubule end association of the microtubule polymerase CKAP5 (also known as ch-TOG and XMAP215). Local π-EB1 photodissociation allows subcellular control of microtubule dynamics at the second and micrometre scale, and elicits aversive turning of migrating cancer cells. Importantly, light-mediated domain splitting can serve as a template to optically control other intracellular protein activities.


Conflict of interest statement

COMPETING FINANCIAL INTERESTS

The authors declare no competing financial interests.

Figures

Figure 1
Figure 1. Design of a light-sensitive EB1 variant that can replace endogenous EB1 function
(a) Interaction of purified LOV2 and Zdk1 analysed by native PAGE. Blue light results in dissociation of the LOV2/Zdk1 complex, which is upshifted compared with the individual proteins. (b) Schematic of the photo-inactivated π-EB1 design resulting in reversible dissociation of the MT-binding and +TIP adapter domains upon blue light exposure. (c) Cell expressing tubulin-mCherry, EGFP-tagged Zdk1-EB1C and unlabelled EB1N-LOV2 before and after 5 s of 488 nm blue light exposure resulting in dissociation of Zdk1-EB1C from growing MT plus ends. (d) Analysis of the blue light-induced EGFP-Zdk1-EB1C dissociation rate from MT ends. Data shown are the mean +/− 95% confidence intervals of n = 9 cells. Solid line is an exponential decay fit. Inset shows comparison of dissociation half-life times of Zdk1-EB1C and SLAIN2, a +TIP that depends on EB1 for MT end association. Statistical analysis by two-tailed t-test. (e) Cell expressing both halves of π-EB1 fluorescently tagged showing that EB1N-LOV2 remains on growing MT ends after blue light exposure. Time stamps indicate duration of blue light exposure. Dual-wavelength images were acquired simultaneously using an emission image splitter. (f) Analysis of the amount of the two π-EB1 halves bound to MT ends before and during 1 s of blue light exposure. n = 9 cells. Statistical analysis by Tukey-Kramer HSD test. (g) Analysis of EB1 and π-EB1 expression in H1299 cell lines in which π-EB1 constructs were stably expressed and endogenous EB1 depleted by shRNA. Immunoblots were probed with antibodies specific to either the EB1 N- or C-terminus and anti-α-tubulin as loading control. Experiments in a and g were replicated three times with similar results. Yellow boxes in c and e indicate regions shown as individual channels at higher magnification. Box plots in d and f show median, first and third quartile, with whiskers extending to observations within 1.5 times the interquartile range, and all individual data points. Unprocessed original blots in Supplementary Fig. 5. Source data in Supplementary Table 3.
Figure 2
Figure 2. Spatially and temporally reversible photo-dissociation of +TIP complexes
(a) Analysis of mCherry-tagged +TIPs on MT ends before and during 1 s of blue light in π-EB1/EB1 shRNA cells. n = 8 (MCAK, CLASP2) and 6 cells (SLAIN2). Statistical analysis by Tukey-Kramer HSD test. (b) Reversible blue light-induced mCherry-SLAIN2 dissociation from MT ends in π-EB1/EB1 shRNA cells. Graph shows the mean +/− standard deviation and individual measurements from the cell shown over multiple blue light cycles. (c) Comparison of Zdk1-EB1C recovery on MT plus ends in cells expressing π-EB1 containing the indicated LOV2 variant. Graph compares Zdk1-EB1C re-association with LOV2(wt) (n = 10 cells) or LOV2(I427V,H519L) (n = 8) showing the mean +/− 95% confidence intervals. Solid lines are exponential curve fits. Statistical analysis by two-tailed t-test. (d) Zdk1-EB1C MT plus-end-association in π-EB1 constructs with the indicated LOV2 variants as function of radiant exposure at steady state after 40 s of pulsed blue light. Exposure was varied by pulse width modulation. Solid lines are exponential curve fits. (e) Patterned blue light exposure within the regions indicated by dashed lines shows high spatiotemporal accuracy of π-EB1 photo-dissociation. The light pattern is switched every 10 s. Images are projections of the indicated time periods (black bars in g) showing sequential time points in alternating green and purple. Right panel: top blue light pattern reflected off the cover glass. (f) Zdk1-EB1C MT plus-end-association at the boundary of the blue light pattern corresponding to the 33-39 s period. Dashed lines demarcate the 95% switch (i.e. +/− 2 σ) in MT end association calculated from a cumulative normal distribution fit (black line). The intensity profile of the light pattern (blue line) was measured from the pattern image in e. (g) Zdk1-EB1C MT plus-end-association as function of time in the top and bottom halves of the cell in e. Solid lines are exponential curve fits. Shaded areas indicate time periods without blue light exposure. Box plots in a and c show median, first and third quartile, with whiskers extending to observations within 1.5 times the interquartile range, and all individual data points. Source data in Supplementary Table 3.
Figure 3
Figure 3. Attenuation of MT growth by π-EB1 photo-dissociation
(a) EB1N-mCherry-LOV2 labelled MT plus ends before, after 30 s during blue light exposure, and after 3 min recovery in the dark in π-EB1/EB1 shRNA cells. Insets show maximum intensity projections over 20 s time windows of the indicated regions at higher magnification. MT growth tracks appear in alternating colours. (b) Quantification of MT polymerization dynamics by tracking EB1N-mCherry-LOV2 labelled MT ends. Growth rates are frame-to-frame measurements from images acquired at 0.5 s intervals. n = 11 cells. Box plots show median, first and third quartile, with whiskers extending to observations within 1.5 times the interquartile range, and all individual data points. Statistical analysis by Tukey-Kramer HSD test. (c) Comparison of the frame-to-frame MT growth rate distribution in the dark and during blue light exposure demonstrating a specific loss of fast growth events as a result of π-EB1 photo-dissociation. Shown are the mean distributions from the cells in b (lines) and 95% confidence intervals (shaded areas). (d) Local inhibition of MT growth by patterned blue light exposure in a π-EB1/EB1 shRNA cell expressing EB1N-mCherry-LOV2. Shown is a maximum intensity projection over 20 s. MT growth tracks appear in alternating colours. Only the top half above the dashed line was exposed to blue light pulses between image acquisitions. Insets show the indicated regions at higher magnification. This experiment was replicated more than five times with similar results. (e) Representative kymographs illustrating the sudden response of rapidly growing MT ends to π-EB1 photo-dissociation. (f) Analysis of the intracellular MT population growth rate response as a function of time after π-EB1 photo-dissociation. Shown are all measurements from n = 5 cells. Solid line is an exponential fit of the mean during blue light exposure. Shaded area is the 95% confidence interval of the fit. Source data in Supplementary Table 3.
Figure 4
Figure 4. π-EB1 photo-dissociation induced MT cytoskeleton reorganization
(a) Tubulin-mCherry expressing π-EB1/EB1 shRNA cell before, after 30 s during blue light exposure, and after 3 min recovery in the dark. Insets show the indicated regions at higher magnification demonstrating reversible decrease of MT density near the cell periphery. (b) Analysis of the relative amount of cytoplasmic tubulin-mCherry in response to π-EB1 photo-dissociation. Shown are all measurements from n = 5 cells normalized to the dark condition. Solid line is an exponential fit of the mean during blue light exposure. Shaded area is the 95% confidence interval of the fit. (c) Rapid depolymerisation of MTs in the cell periphery in response to π-EB1 photo-dissociation. Arrows highlight example MTs. (d) Life-history plots of MTs with ends near the cell edge aligned to the time of blue light exposure. n = 33 MTs from 5 cells. The purple line is the average of linear fits of the depolymerizing phase of these MTs. Shaded area indicates 95% confidence interval. (e) Time-lapse sequence of tubulin-mCherry in a Rac(Q61L)-expressing π-EB1 cell in response to local blue light exposure (above the dashed line) illustrating sustained reorganization of the MT network. This experiment was replicated more than five times with similar results. Source data in Supplementary Table 3.
Figure 5
Figure 5. EB1-independent MT plus end localization of the MT polymerase CKAP5
(a) TIRF microscopy of a control H1299 cell expressing EB1N-EGFP-LOV2 and CKAP5-mKate2. Note that wavelengths were acquired sequentially resulting in a small temporal shift between channels, and punctate appearance of CKAP5 compared to the typical comet shaped EB1 distribution. Insets show indicated regions at higher magnification. (b) Time-lapse sequence showing variable and transient CKAP5 accumulation on MT ends. Arrows highlight representative MT ends. Elapsed time in seconds. (c) Scatter plot of the relative accumulation of CKAP5 and EB1 on the same MT ends showing only a very weak correlation. Solid line is a linear fit. n = 252 MT ends from 5 cells. (d) TIRF microscopy of CKAP5-mKate2 in a π-EB1/EB1 shRNA cell 15 s before and during π-EB1 photo-dissociation showing qualitative indistinguishable CKAP5 distribution. Insets show projections over 20 s time windows of the indicated regions, revealing linear tracks of CKAP5 dots. (e) Time-lapse sequence of CKAP5-mKate2 dynamics before and during blue light exposure in a π-EB1/EB1 shRNA cell. Arrows highlight linear movement of MT end-associated CKAP5 dot. Elapsed time in seconds. (f) CKAP5 enrichment on MT ends in the indicated time intervals before and during blue light exposure indicating no change in response to π-EB1 photo-dissociation. Statistical analysis by Tukey-Kramer HSD test. Box plots show median, first and third quartile, with whiskers extending to observations within 1.5 times the interquartile range, and all individual data points. n = 8 cells. (g) EB1N-mCherry-LOV2 labelled MT plus ends in control H1299 cells and in cells in which both EB1 and EB3 expression were deleted by CRISPR/Cas9 genome editing showing attenuation of MT growth in EB1/3 −/− cells. (h) EB1N-mCherry-LOV2 labelled MT plus ends in a EB1/3 −/− π-EB1 rescue cell before and during blue light exposure demonstrating light-induced MT growth attenuation very similar to what we observe in π-EB1/EB1 shRNA cells. In g and h, insets show maximum intensity projections over 20 s time windows of the indicated regions. MT growth tracks appear in alternating colours. Experiments were replicated more than five times with similar results. Source data in Supplementary Table 3.
Figure 6
Figure 6. Aversive cell turning in response to local π-EB1 photo-dissociation
(a) Time-lapse sequence of a control H1299 cell expressing EB3-mCherry showing no response to local blue light exposure. (b) Two examples of EB1/3 −/− π-EB1 rescue cells that turn away from local blue light exposure in the front half of the cell. Cells also express mCherry-Zdk1-EB1C to show local π-EB1 photo-dissociation. Blue areas are images of the blue light exposure patterns reflected off the coverslip. Yellow lines show the cell centroid trajectory. 0 min indicates the time when the respective blue light pattern was switched on. (c) Analysis of cell migration direction changes over half hour time intervals expressed as the angle between smoothened centroid positions 15 min before and 15 min after the indicated time points. A significant non-random change in migration direction only occurred in response to local blue light exposure in EB1/3 −/− π-EB1 rescue cells, which consistently turned away from the pattern. n = 12 cells (control); 13 cells (EB1/3 −/− π-EB1). Box plots show median, first and third quartile, with whiskers extending to observations within 1.5 times the interquartile range, and all individual data points. Statistical analysis by Tukey-Kramer HSD test. (d) Time-lapse sequence of a migrating EB1/3 −/− π-EB1 rescue cell trapped inside a virtual blue light box for over 8 hours. Yellow line marks the centroid trajectory. This was replicated more than three times with similar results.

References

    1. Ohi R, Zanic M. Ahead of the Curve: New Insights into Microtubule Dynamics. F1000Res. 2016;5 - PMC - PubMed
    1. Akhmanova A, Steinmetz MO. Control of microtubule organization and dynamics: two ends in the limelight. Nat Rev Mol Cell Biol. 2015;16:711–726. - PubMed
    1. Kumar P, Wittmann T. +TIPs: SxIPping along microtubule ends. Trends Cell Biol. 2012;22:418–428. - PMC - PubMed
    1. Kumar P, et al. GSK3beta phosphorylation modulates CLASP-microtubule association and lamella microtubule attachment. J Cell Biol. 2009;184:895–908. - PMC - PubMed
    1. Pemble H, Kumar P, van HJ, Wittmann T. GSK3-mediated CLASP2 phosphorylation modulates kinetochore dynamics. J Cell Sci. 2017;130:1404–1412. - PMC - PubMed

Publication types

MeSH terms

Substances