. 2018 Apr;12(4):1154-1162.
doi: 10.1038/s41396-017-0042-4. Epub 2018 Jan 29.

Deposition rates of viruses and bacteria above the atmospheric boundary layer

Affiliations

Deposition rates of viruses and bacteria above the atmospheric boundary layer

Isabel Reche et al. ISME J. 2018 Apr.

Abstract

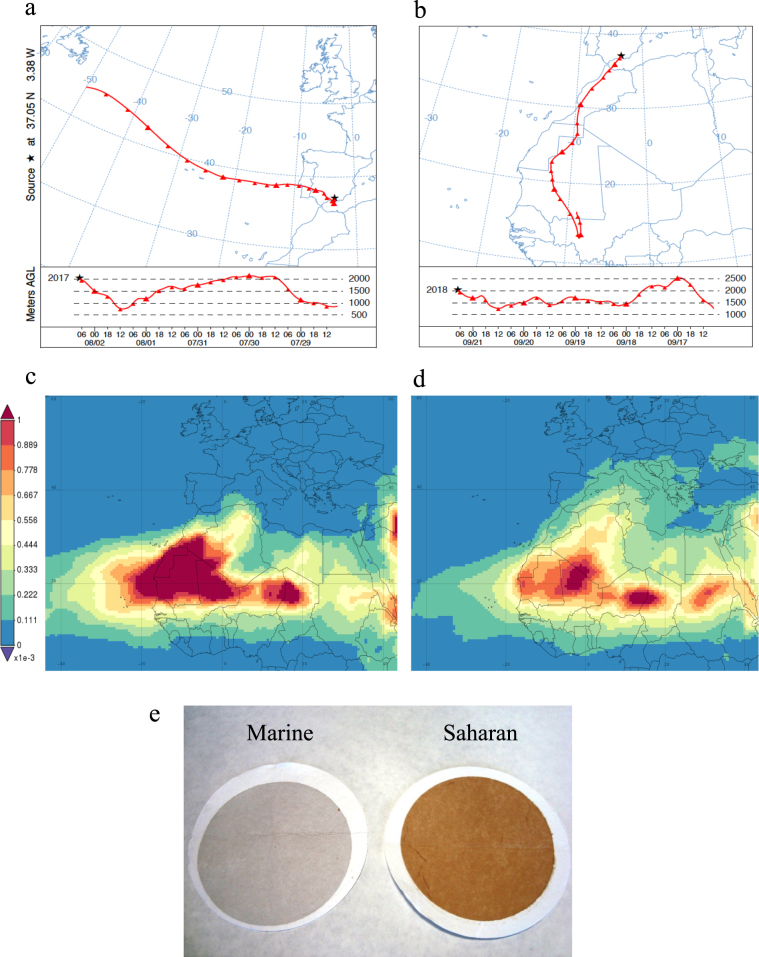
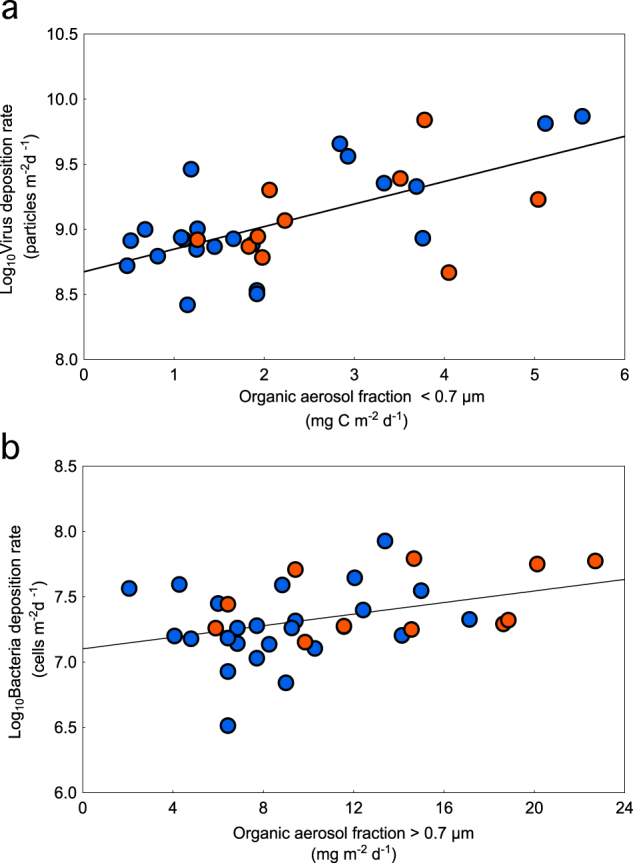
Aerosolization of soil-dust and organic aggregates in sea spray facilitates the long-range transport of bacteria, and likely viruses across the free atmosphere. Although long-distance transport occurs, there are many uncertainties associated with their deposition rates. Here, we demonstrate that even in pristine environments, above the atmospheric boundary layer, the downward flux of viruses ranged from 0.26 × 10⁹ to >7 × 10⁹ m-2 per day. These deposition rates were 9-461 times greater than the rates for bacteria, which ranged from 0.3 × 10⁷ to >8 × 10⁷ m-2 per day. The highest relative deposition rates for viruses were associated with atmospheric transport from marine rather than terrestrial sources. Deposition rates of bacteria were significantly higher during rain events and Saharan dust intrusions, whereas, rainfall did not significantly influence virus deposition. Virus deposition rates were positively correlated with organic aerosols <0.7 μm, whereas, bacteria were primarily associated with organic aerosols >0.7 μm, implying that viruses could have longer residence times in the atmosphere and, consequently, will be dispersed further. These results provide an explanation for enigmatic observations that viruses with very high genetic identity can be found in very distant and different environments.


Conflict of interest statement

The authors declare that they have no conflict of interest.

Figures

Fig. 1
Fig. 1
Representative 4-day backward trajectory for a period with predominance of air masses coming from a the Atlantic Ocean and b the Saharan desert obtained with the HYSPLIT model. Red lines on the maps are the air trajectories and black stars indicate the collector sites. Red lines at the bottom show the altitude of the trajectories in meters above ground level. Representative maps of time-averaged dust-column mass density in kg m−2 for a period with predominance of c Westerlies from the Atlantic Ocean (August 1–3, 2008) and d Saharan dust intrusions toward the Mediterranean basin (4–21 September 2008) obtained with the MERRA-2 model and e representative filters of particulate matter of aerosol mostly of marine or Saharan origin
Fig. 2
Fig. 2
Abundances of free (empty circles) and free plus particle-attached (filled circles) a viruses and b bacteria in the dry and wet collectors. Samples of predominantly marine origin are shown as blue circles, whereas, samples that are primarily Saharan in origin are shown as orange circles. The median value (line), the 25–75% percentiles (boxes), and the non-outlier range (whiskers) of the (free plus particle-attached) abundance of c viruses and d bacteria in the wet (atmospheric washout) and dry (sedimentation) collectors
Fig. 3
Fig. 3
Synchronous dynamics of total (dry + wet) deposition rates of a viruses, c bacteria, and e virus-to-bacteria ratios at the Observatory (OSN) (circles) and Veleta Peak (VSN) (stars) in Sierra Nevada, Spain. Gray marks on the top axis indicate rain events. Samples that are predominantly marine in origin are shown in blue and samples that are predominantly Saharan are shown in orange. The median value (line), the 25–75% percentiles (boxes), the non-outlier range (whiskers), and extreme values (circles) of b viruses, d bacteria, and f virus-to-bacteria ratio in the total deposition sorted by air-mass origin (marine vs. Saharan) and by meteorological conditions (rainy vs. clear)
Fig. 4
Fig. 4
Deposition rates of a viruses and b bacteria associated with different size fractions of organic aerosols. Virus deposition rates were significantly correlated to the organic fraction of aerosols smaller than 0.7 μm (n = 32, r = 0.62, p < 0.01), whereas bacteria deposition rates were significantly correlated to the organic fraction of aerosols with a size >0.7 μm (n = 36, r = 0.38, p < 0.05). Samples that were predominantly marine in origin are shown as blue circles, and samples with predominantly Saharan in origin are shown as orange circles

References

    1. Suttle CA. Viruses in the sea. Nature. 2005;437:356–61. doi: 10.1038/nature04160. - DOI - PubMed
    1. Weinbauer MG. Ecology of prokaryotic viruses. FEMS Microbiol Rev. 2004;28:127–81. doi: 10.1016/j.femsre.2003.08.001. - DOI - PubMed
    1. Breitbart M. Marine viruses: truth or dare. Ann Rev Mar Sci. 2012;4:425–48. doi: 10.1146/annurev-marine-120709-142805. - DOI - PubMed
    1. Short CM, Suttle CA. Nearly identical bacteriophage structural gene sequences are widely distributed in both marine and freshwater environments. Appl Environ Microbiol. 2005;71:480–6. doi: 10.1128/AEM.71.1.480-486.2005. - DOI - PMC - PubMed
    1. Breibart M, Rohwer F. Here a virus, there a virus, everywhere the same virus? Trends Microbiol. 2005;13:278–84. doi: 10.1016/j.tim.2005.04.003. - DOI - PubMed

Publication types