. 2018 Jan 29;8(1):1749.
doi: 10.1038/s41598-018-20206-6.

Exploration of the role of the virulence factor ElrA during Enterococcus faecalis cell infection

Affiliations

Exploration of the role of the virulence factor ElrA during Enterococcus faecalis cell infection

Natalia Nunez et al. Sci Rep. .

Abstract

Enterococcus faecalis, an organism generally not pathogenic for healthy humans, has the potential to cause disease in susceptible hosts. While it seems to be equipped to interact with and circumvent host immune defense, most of the molecular and cellular mechanisms underlying the enterococcal infectious process remain elusive. Here, we investigated the role of the Enterococcal Leucine Rich protein A (ElrA), an internalin-like protein of E. faecalis also known as a virulence factor. ElrA was previously shown to prevent adhesion to macrophages. We show that ElrA does not inhibit the basic phagocytic process, but is able to prevent sensing and migration of macrophages toward E. faecalis. Presence or absence of FHL2, a eukaryotic partner of ElrA, does not affect the ElrA-dependent mechanism preventing macrophage migration. However, we highlight a partial contribution of FHL2 in ElrA-mediated virulence in vivo. Our results indicate that ElrA plays at least a dual role of which anti-phagocytic activity may contribute to dissemination of extracellular E. faecalis during infection.


Conflict of interest statement

The authors declare that they have no competing interests.

Figures

Figure 1
Figure 1
Effect of ElrA expression on E. faecalis envelope (A) Cell wall polysaccharide profiles from the OG1RF, P+-elrA-E and P+elrA strains recovered in exponential growth phase. Abbreviations: EPA, Enterococcal Polysaccharide Antigen; TA, teichoic acids. (B) Thickness of the polysaccharide pellicle (PS), the intermediate translucent region (ITR) and of the peptidoglycan layer (PG) was measured from electronic microscopy images using Image J software. Three measurements were made per bacteria. Mean values and SEM were calculated on 10 independent bacteria. Statistical analysis was performed using unpaired Student’s t test.
Figure 2
Figure 2
Effect of ElrA expression on E. faecalis biofilm (A) Biofilms of the OG1RF wild-type strain, the P+-elrA-E strain, the P+elrA and the CPL-elrA strain were observed after 6 h incubation and growth at 37 °C without washes. (B) Right panel: Biofilms of ElrA isogenic strains were observed 6 h post-inoculation in BHI and after washes. Left panel: Biomass was calculated from the raw images using Image J software and Comstat plugin. Data are represented as mean with SEM from two independent experiments. Statistical analysis was performed using unpaired Student’s t test. Asterisks indicate a p-value considered statistically significant (*P < 0.05). All biofilms were observed by confocal microscopy; white scale bars, 20 μm. Image projections were obtained using IMARIS software.
Figure 3
Figure 3
Effect of ElrA-expressing E. faecalis on host cells. Exponentially growing E. faecalis strains were used to infect Raw264.7 macrophages and placental cells (Jeg-3), hepatic cells (HepG2), epithelial cervical (Hela) cells, fibroblastic kidney cells (ACHN), colonic epithelial cells (Caco-2), ileocecal epithelial cells (HCT-8), and epithelial kidney cells (A-704). Percentage of invasion was determined as the ratio of intracellular bacteria to the initial inoculum. Data are represented as mean with SEM of at least 3 independent experiments for each cell line. Statistical analysis was performed using unpaired Student’s t test. Asterisks indicate a p-value considered statistically significant (*P < 0.05; **P < 0.01; ***P < 0.001).
Figure 4
Figure 4
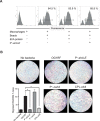
Effect of ElrA on macrophage phagocytosis and migration (A) Raw 264.7 macrophages were incubated with fluorescent beads and incubated with P+-elrA-E or 10 nM of purified ElrA protein for 3 h prior to incubation with fluorescent beads. Histograms represent the distribution of macrophages phagocytizing fluorescent beads. Percentage of bead-positive macrophages was calculated by gating on live macrophages (not shown). Representative flow cytometry histograms from two independent experiments are shown. (B) Cell migration was observed after ~20 h of incubation on an inverted light microscope. Macrophages trapped in the membrane are stained with Giemsa coloration. Representative field of three independent experiments are shown. Migrating Raw264.7 macrophages were counted in five random fields per well at 20× magnification. Data are represented as mean with SEM of three independent experiments. Asterisks indicate a p-value considered statistically significant (*P < 0.05).
Figure 5
Figure 5
Effect of FHL2-ElrA interaction in E. faecalis infection. (A) Migrating macrophages (Left panel, wild type bone-morrow derived macrophages or BMDMs; right panel, FHL2−/− BMDMs) were counted in five random fields per well at 20 × magnification. Data are represented as mean with SEM. Statistical analysis was performed using unpaired Student’s t test on a representative experiment from two independent experiments. (B) C57BL/6 wild type and FHL2−/− mice were infected intravenously with 5 × 108 CFUs of OG1RF wild type or ΔelrA strain. The liver, the spleen, and the kidneys were harvested 24 hours post-infection and serial dilutions of organ homogenates were plated on selective enterococci agar medium (BEA). Each dot corresponds to one mouse (n = 12) and were obtained from three independent experiments. Black bars represent median values. Statistical analysis was performed using Mann-Whitney test on three independent experiments. Asterisks indicate a p-value considered statistically significant (*P < 0.05, **P < 0.01, ***P < 0.001).

References

    1. Ubeda C, et al. Vancomycin-resistant Enterococcus domination of intestinal microbiota is enabled by antibiotic treatment in mice and precedes bloodstream invasion in humans. J Clin Invest. 2010;120:4332–4341. doi: 10.1172/JCI43918. - DOI - PMC - PubMed
    1. Arias CA, Murray BE. The rise of the Enterococcus: beyond vancomycin resistance. Nat Rev Microbiol. 2012;10:266–278. doi: 10.1038/nrmicro2761. - DOI - PMC - PubMed
    1. Sievert DM, et al. Antimicrobial-resistant pathogens associated with healthcare-associated infections: summary of data reported to the National Healthcare Safety Network at the Centers for Disease Control and Prevention, 2009–2010. Infect Control Hosp Epidemiol. 2013;34:1–14. doi: 10.1086/668770. - DOI - PubMed
    1. Sava IG, Heikens E, Huebner J. Pathogenesis and immunity in enterococcal infections. Clin. Microbiol Infect. 2010;16:533–540. doi: 10.1111/j.1469-0691.2010.03213.x. - DOI - PubMed
    1. Brinster S, et al. Enterococcal leucine-rich repeat-containing protein involved in virulence and host inflammatory response. Infect Immun. 2007;75:4463–4471. doi: 10.1128/IAI.00279-07. - DOI - PMC - PubMed

Publication types