. 2017 Oct-Dec;27(4):417-426.
doi: 10.4103/ijri.IJRI_451_16.

Spinal dysraphism illustrated; Embroyology revisited

Affiliations

Spinal dysraphism illustrated; Embroyology revisited

Ullas V Acharya et al. Indian J Radiol Imaging. 2017 Oct-Dec.

Abstract

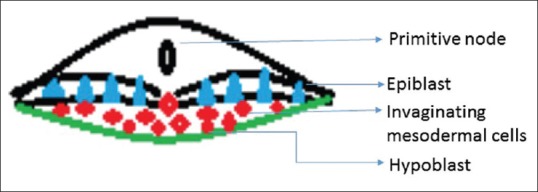
Spinal cord development occurs through three consecutive periods of gastrulation, primary nerulation and secondary neurulation. Aberration in these stages causes abnormalities of the spine and spinal cord, collectively referred as spinal dysraphism. They can be broadly classified as anomalies of gastrulation (disorders of notochord formation and of integration); anomalies of primary neurulation (premature dysjunction and nondysjunction); combined anomalies of gastrulation and primary neurulation and anomalies of secondary neurulation. Correlation with clinical and embryological data and common imaging findings provides an organized approach in their diagnosis.

Keywords: Embryology; illustrated; magnetic resonance imaging; spinal dysraphism.


Conflict of interest statement

There are no conflicts of interest.

Figures

Figure 1
Figure 1
Gastrulation – Process of formation of trilaminar disc
Figure 2
Figure 2
Primary neurulation – Neural plate folds on itself to form a neural tube which closes in a zipper-like manner and separates from the overlying surface ectoderm which forms the epidermis
Figure 3
Figure 3
Secondary neurulation – Caudal cell mass coalesces, becomes continuous with the cranial part of the tube initially formed by primary neurulation, and undergoes both regression and differentiation, a process called retrogressive differentiation
Figure 4(A-C)
Figure 4(A-C)
Cutaneous manifestations – (A) Atrophic patch with dermal sinus (arrow); (B) Pseudotail (arrow) with hyperpigmentation (*). (C) Lipoma (black arrow) with dermal sinus (yellow arrow)
Figure 5(A and B)
Figure 5(A and B)
Hypertrichosis – (A) Silky down type – short and fine vellus hairs. (B) Faun tail type – long coarse terminal hairs
Figure 6(A-C)
Figure 6(A-C)
Partial sacral agenesis – Sagittal T1 (A) and Sagittal T2 (B) weighted images of lumbosacral spine showing partial agenesis of sacrum (arrow in A), low lying cord (arrow in B) and lipomatous thickening of filum terminale (*in A). Coronal T2 (C) image demonstrates L5 butterfly vertebra (arrow)
Figure 7(A-E)
Figure 7(A-E)
Segmental spinal dysgenesis – Sagittal T2-weighted (A and B), axial T2-weighted (C and D), and sagittal CT reconstruction (E) of lumbosacral spine shows focal lumbar kyphotic deformity (arrow in A and E) with indiscernible spinal cord at the same level, normal spinal canal dimension of cranial segment (C) and bulky low lying caudal cord segment (*in B and D)
Figure 8(A-C)
Figure 8(A-C)
Neurenteric cyst – Axial T1-weighted (A) and sagittal T2-weighted (B) MR images show a cyst (*) located in anterior subarachnoid space opposite C7-T2 vertebra. It shows no enhancement on axial T1 post contrast (C)
Figure 9(A and B)
Figure 9(A and B)
Type 1 diastematomyelia – Axial T1-weighted (A) and axial T2-weighted (B) MR images show two dural tubes separated by osseous bridge (*) at L1 vertebral level. Syrinx is noted within right hemicord (yellow arrow)
Figure 10(A-C)
Figure 10(A-C)
Type 2 diastematomyelia – Axial T1-weighted (A), axial T2-weighted (B), coronal STIR (C) MR images show splitting of distal cord into two hemicords (*) within single dural tube (arrow in B)
Figure 11
Figure 11
(A and B): Lipomyelocele – Sagittal T1 (A) and axial T2 images (B) of lipomyelocele shows placode–lipoma interface lying within spinal canal (arrow)
Figure 12(A-C)
Figure 12(A-C)
Lipomyelomeningocele – Sagittal T1-weighted (A) and axial T2-weighted images (B) of lipomyelomeningocele shows placode–lipoma interface (arrow) lying outside the spinal canal due to expansion of subarachnoid space. There is suppression of lipoma at interface as seen on axial T2 STIR images (C)
Figure 13(A-C)
Figure 13(A-C)
Intradural lipoma – Sagittal T1-weighted (A), sagittal T2-weighted (B), and axial T2-weighted (C) MR images show large intradural lipoma (*) opposite C7 to D4 vertebral level. It is hyperintense on T1 and T2-weighted image and showed suppression on T2-weighted fat-saturated image (not shown)
Figure 14(A-C)
Figure 14(A-C)
Filar lipoma – Axial T1 (A) and sagittal T1 (B) weighted MR images show thickened hyperintense filum terminale which suppresses on axial fat saturated image (C) (arrow)
Figure 15(A-C)
Figure 15(A-C)
Dorsal dermal sinus with epidermoid cyst – sagittal T1-weighted (A), sagittal T2 weighted (B), and sagittal T1 postcontrast FS (C) images show a T1 hypointense, T2 hyperintense sinus tract (arrow) at L5 level, which shows diffuse homogenous postcontrast enhancement. Associated peripherally enhancing T1 hypointense, T2 hyperintense epidermoid cyst (**) is noted opposite L3-5 level with focal cord syrinx (*) and T2 hyperintense signals at D12–L1
Figure 16(A-D)
Figure 16(A-D)
Dermoid cyst – coronal T1-weighted (A), coronal T2-weighted (B), coronal STIR (C), and Coronal T1FS postcontrast (D) sequences show a long segment heterogeneous lesion causing expansion of cord. Cranial part of the lesion (limited by arrows) shows fat signals (*) whereas larger caudal part of the lesion is predominantly cystic and shows peripheral enhancement (**)
Figure 17
Figure 17
Ruptured dermoid cyst – sagittal T1-weighted image shows cervical T1 hyperintense lesion (*). Note multiple small T1 hyperintense punctate foci along sylvian fissure and frontal lobe sulci (arrows)
Figure 18(A-C)
Figure 18(A-C)
Myelomeningocele – sagittal T1 (A), T2 (B), and axial T2 (C) weighted images show low lying cord with neural placode (arrow) protruding above skin surface due to expansion of underlying subarachnoid space
Figure 19
Figure 19
Hemimyelomeningocele – axial T2-weighted image shows type 1 diastometamyelia with the left hemicord (*) seen ending within a myelomeningocele sac (**). Note also malpositioned, malaligned kidneys (arrows)
Figure 20(A-C)
Figure 20(A-C)
Low lying tethered cord – sagittal T1 (A), sagittal T2 (B), and axial T2-weighted (C) images show low lying tethered cord (arrow in A and B) with thickened filum terminale (arrow in C) at S1 level (arrow in C)
Figure 21
Figure 21
(A and B): Intrasacral meningocele – sagittal T1-weighted (A) and sagittal T2-weighted (B) images show CSF intensity lesion (*) in sacral canal
Figure 22(A-D)
Figure 22(A-D)
Terminal myelocystocele with lipomyelocele – sagittal T2-weighted image (A) and axial T2-weighted images (B-D) show syrinx involving lower cord (arrows in A and B), focal terminal flaring of syrinx (* in A and C) surrounded by pockets of meningoceles (** in A and D). Liponeural junction is shown with yellow arrow in A

References

    1. Barkovich AJ, Millen KJ, Dobyns WB. A developmental classification of malformations of the brainstem. Ann Neurol. 2007;62:625–39. - PubMed
    1. Parisi MA, Dobyns WB. Human malformations of the midbrain and hindbrain: Review and proposed classification scheme. Mol Genet Metab. 2003;80:36–53. - PubMed
    1. Patel S, Barkovich AJ. Analysis and Classification of Cerebellar Malformations. Am J Neuroradiol. 2002;23:1074–87. - PMC - PubMed
    1. Tortori-Donati P, Rossi A, Cama A. Spinal dysraphism: A review of neuroradiological features with embryological correlations and proposal for a new classification. Neuroradiology. 2000;42:471–91. - PubMed
    1. Rufener S, Ibrahim M, Parmar HA. Imaging of Congenital Spine and Spinal Cord Malformations. Neuroimaging Clin N Am. 2011;21:659–76. - PubMed