. 2018;5(13):35-45.
doi: 10.20455/ros.2018.809. Epub 2018 Jan 1.

A Novel Fluorescence-Based Assay for the Measurement of Biliverdin Reductase Activity

Affiliations

A Novel Fluorescence-Based Assay for the Measurement of Biliverdin Reductase Activity

Samuel O Adeosun et al. React Oxyg Species (Apex). 2018.

Abstract

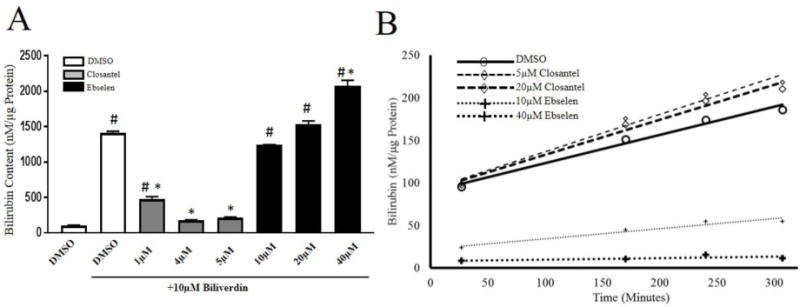
Biliverdin reductase (BVR) is the enzyme responsible for the last step in the production of bilirubin from the breakdown of heme. Bilirubin is one of the most potent antioxidant molecules in the body. Monitoring BVR activity is essential in studying the antioxidant capacity of cells and tissues. Traditional methods of determining BVR activity have relied on the measurement of bilirubin converted from biliverdin using absorbance spectroscopy. The approach has limited sensitivity and requires large quantities of cells or tissues. We have developed a novel fluorescence-based method utilizing the eel protein, UnaG, for the detection of bilirubin produced by BVR. The UnaG protein only fluoresces by the induction of bilirubin. We have also used this approach to measure intracellular bilirubin content of cultured cells. We validated this assay using cell lysates from mouse liver and immortalized murine hepatic cell line (Hepa1c1c7) and kidney cell line (MCT) in which BVR isoform A (BVRA) was either knocked out via CRISPR or stably overexpressed by lentivirus. Also, we tested the method using previously reported putative BVRA inhibitors, Closantel and Ebselen. These studies show a new method for measuring bilirubin intracellularly and in lysates.

Keywords: Antioxidant; Bilirubin; Heme Oxygenase; Oxidative Stress; UnaG.


Figures

Figure 1
Figure 1. Bilirubin standard curve with UnaG and lysate-based BVR assay
(A) Standard curve with various concentrations of Bilirubin in PBS detected with 35µg/mL (final concentration) of purified UnaG. (B). BVR assay with 400µg of lysates of liver tissues from control (y = 24.5x – 69.0) and Liver-specific BVRA-KO (L-BVRA-KO) mice (y = 4.9x – 0.8). Lysate-based BVRA assay with 400µg of (C) BVRA-KO (QCXIP-Vector; y = −0.04x – 24.9) and BVRA-overexpressing (QCXIP-BVRA; y = 1.4x – 179.5) MCT cells and (D) Control (y = 0.6x – 34.4) and BVR-KO (y = −0.03x – 19.2) Hepa1c1c7 cells. For B-D, 3 independent reactions (read in duplicates) were set up for each of the cell lines. The assays were set up as described in Protocol and Steps (3.1) above. The bilirubin production was monitored with UnaG included in the reaction.
Figure 2
Figure 2. Time and concentration optimization for in-cell BVR assay
Control and BVRA-KO MCT cells were treated with 10µM or 40µM Biliverdin for 1, 2 or 4hrs. After washing with PBS, cells were lysed with RIPA buffer and Bilirubin content (expressed in nM/µg protein) were determined as described in Protocols and Steps (3.2.2). Bars represent Mean±SEM. *= p<0.05 as compared to control. † = p<0.05 as compared to 1 hour treatment. & = p<0.05 as compared to 2-hour treatment. #= p<0.05 as compared to corresponding value in 10 μM treated. n=3/group.
Figure 3
Figure 3. In-Cell BVR Assay in MCT and Hepa1c1c7 cells
(A) Western blot showing BVRA expression in the different MCT cells used. (B) In-Cell BVR assay of the different MCT cells using 10µM or 40µM Biliverdin for 1hr. (C) In-cell BVR Assay in BVRA-KO (QCXIP-Vector) and BVRA-overexpressing (QCXIP-BVRA) MCT cells with lower concentrations of Biliverdin and 1hr incubation. (D) In-cell BVR Assay in control and BVRA-KO Hepa1c1c7 cells. For B-D, following treatment, cells were washed with PBS, lysed with RIPA buffer and Bilirubin content (expressed in nM/µg protein) were determined as described in Protocols and Steps (3.2.2). Bars represent Mean±SEM. * =P<0.05 as compared to DMSO treated. n=3/group.
Figure 4
Figure 4. Bilirubin content in typical cell culture serum and intracellular bilirubin content in MCT cells
(A) Bilirubin content of Bovine calf serum (BCS) and Fetal Bovine Serum (FBS) determined in various dilutions of the sera in PBS. (B) Bilirubin content of control and BVRA-KO MCT cells grown overnight in 6cm plates with serum-free (DMEM-F12) medium. Bars represent Mean±SEM. * = p<0.05 as compared to 2.5%. # = p<0.05 as compared to control. n=3/group.
Figure 5
Figure 5. Effects of BVR inhibitors in lysate-based and in-cell BVR assays
(A) In-cell BVR assay as described in section 3.2.2 after 23hr pretreatment of control MCT cells with DMSO or various concentrations of putative BVR inhibitors (Closantel and Ebselen). Bars represent Mean±SEM. N=3 in all bars. (B) Lysate-based BVR assay as described in section 3.1.2 in the presence of various concentrations of putative BVR inhibitors (Closantel and Ebselen). The slopes are measures of BVR activity. (DMSO: y=0.33x+90.3; 5µM Closantel: y=0.44x+92.8; 20µM Closantel: y=0.41x+91.8; 10µM Ebselen: y=0.12x+22.8; 40µM Ebselen: y=0.02x+8.3). # =P<0.05 as compared to DMSO alone. * =p<0.05 as compared to DMSO + biliverdin. n=3/group.

References

    1. Abraham NG, Kappas A. Pharmacological and clinical aspects of heme oxygenase. Pharmacol Rev. 2008;60:79–127. - PubMed
    1. Andersson C, Weeke P, Fosbol EL, Brendorp B, Kober L, Coutinho W, Sharma AM, Van Gaal L, Finer N, James WP, Caterson ID, Rode RA, Torp-Pedersen C, Committee SES, and investigators S Acute effect of weight loss on levels of total bilirubin in obese, cardiovascular high-risk patients: an analysis from the lead-in period of the Sibutramine Cardiovascular Outcome trial. Metabolism. 2009;58:1109–1115. - PubMed
    1. Han SS, Na KY, Chae DW, Kim YS, Kim S, Chin HJ. High serum bilirubin is associated with the reduced risk of diabetes mellitus and diabetic nephropathy. Tohoku J Exp Med. 2010;221:133–140. - PubMed
    1. Haverty TP, Kelly CJ, Hines WH, Amenta PS, Watanabe M, Harper RA, Kefalides NA, Neilson EG. Characterization of a renal tubular epithelial cell line which secretes the autologous target antigen of autoimmune experimental interstitial nephritis. J Cell Biol. 1988;107:1359–1368. - PMC - PubMed
    1. Hinds TD, Jr, Burns KA, Hosick PA, McBeth L, Nestor-Kalinoski A, Drummond HA, AlAmodi AA, Hankins MW, Vanden Heuvel JP, Stec DE. Biliverdin reductase A attenuates hepatic steatosis by inhibition of glycogen synthase kinase (GSK) 3beta phosphorylation of serine 73 of peroxisome proliferator-activated receptor (PPAR) alpha. J Biol Chem. 2016 - PMC - PubMed

LinkOut - more resources