

Diabetes and Hypertension in India: A Nationally Representative Study of 1.3 Million Adults
- PMID: 29379964
- PMCID: PMC5885928
- DOI: 10.1001/jamainternmed.2017.8094
Diabetes and Hypertension in India: A Nationally Representative Study of 1.3 Million Adults
Abstract
Importance: Understanding how diabetes and hypertension prevalence varies within a country as large as India is essential for targeting of prevention, screening, and treatment services. However, to our knowledge there has been no prior nationally representative study of these conditions to guide the design of effective policies.
Objective: To determine the prevalence of diabetes and hypertension in India, and its variation by state, rural vs urban location, and individual-level sociodemographic characteristics.
Design, setting, and participants: This was a cross-sectional, nationally representative, population-based study carried out between 2012 and 2014. A total of 1 320 555 adults 18 years or older with plasma glucose (PG) and blood pressure (BP) measurements were included in the analysis.
Exposures: State, rural vs urban location, age, sex, household wealth quintile, education, and marital status.
Main outcomes and measures: Diabetes (PG level ≥126 mg/dL if the participant had fasted or ≥200 mg/dL if the participant had not fasted) and hypertension (systolic BP≥140 mm Hg or diastolic BP≥90 mm Hg).
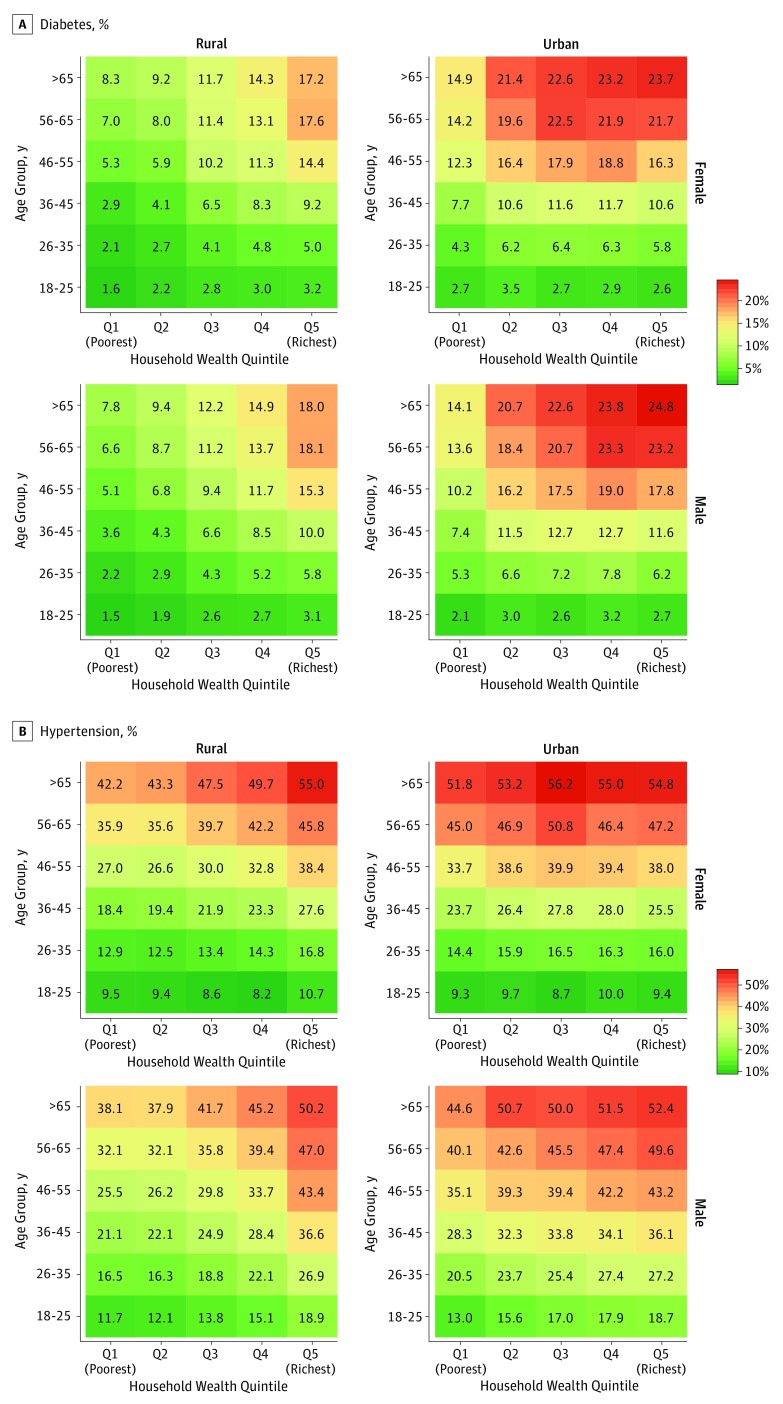
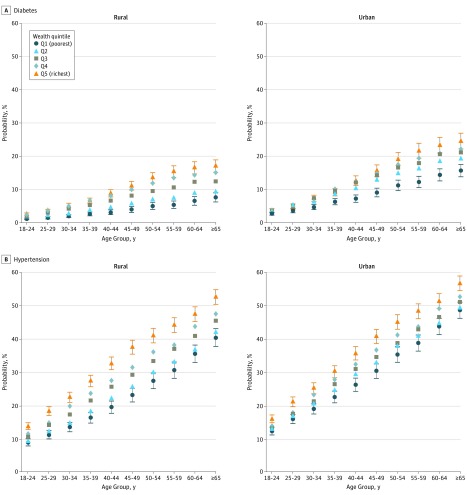
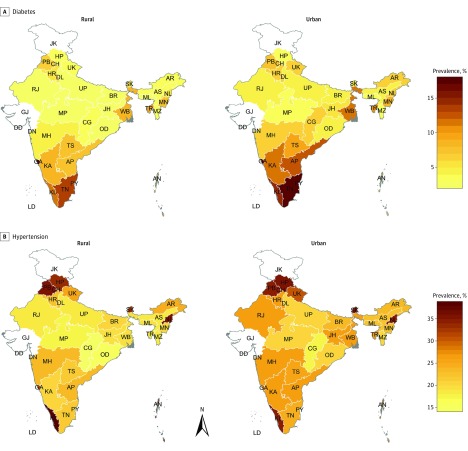
Results: Of the 1 320 555 adults, 701 408 (53.1%) were women. The crude prevalence of diabetes and hypertension was 7.5% (95% CI, 7.3%-7.7%) and 25.3% (95% CI, 25.0%-25.6%), respectively. Notably, hypertension was common even among younger age groups (eg, 18-25 years: 12.1%; 95% CI, 11.8%-12.5%). Being in the richest household wealth quintile compared with being in the poorest quintile was associated with only a modestly higher probability of diabetes (rural: 2.81 percentage points; 95% CI, 2.53-3.08 and urban: 3.47 percentage points; 95% CI, 3.03-3.91) and hypertension (rural: 4.15 percentage points; 95% CI, 3.68-4.61 and urban: 3.01 percentage points; 95% CI, 2.38-3.65). The differences in the probability of both conditions by educational category were generally small (≤2 percentage points). Among states, the crude prevalence of diabetes and hypertension varied from 3.2% (95% CI, 2.7%-3.7%) to 19.9% (95% CI, 17.6%-22.3%), and 18.0% (95% CI, 16.6%-19.5%) to 41.6% (95% CI, 37.8%-45.5%), respectively.
Conclusions and relevance: Diabetes and hypertension prevalence is high in middle and old age across all geographical areas and sociodemographic groups in India, and hypertension prevalence among young adults is higher than previously thought. Evidence on the variations in prevalence by state, age group, and rural vs urban location is critical to effectively target diabetes and hypertension prevention, screening, and treatment programs to those most in need.
Conflict of interest statement
Figures
Comment in
-
India's Call to Action-Prioritize Chronic Cardiovascular Disease.JAMA Intern Med. 2018 Mar 1;178(3):373-374. doi: 10.1001/jamainternmed.2017.8083. JAMA Intern Med. 2018. PMID: 29379951 No abstract available.
References
-
- World Health Organization Global Action Plan for the Prevention and Control of Noncommunicable Diseases 2013–2020. Geneva, Switzerland: World Health Organization; 2013.
-
- United Nations Population Division The World Population Prospects: 2015 Revision. New York, NY: United Nations; 2015.
-
- Institute for Health Metrics and Evaluation (IHME) GBD Compare Data Visualization. 2016; https://vizhub.healthdata.org/gbd-compare/. Accessed October 25, 2017.
-
- United Nations Population Division 2014 Revision of World Urbanization Prospects. New York, NY: United Nations; 2014.
MeSH terms
LinkOut - more resources
Full Text Sources
Other Literature Sources
Medical
