Signaling and metabolic properties of fast and slow smooth muscle types from mice
- PMID: 29380055
- PMCID: PMC5854729
- DOI: 10.1007/s00424-017-2096-6
Signaling and metabolic properties of fast and slow smooth muscle types from mice
Abstract
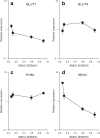
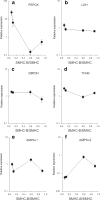
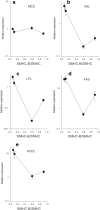
This study aims to improve the classification of smooth muscle types to better understand their normal and pathological functional phenotypes. Four different smooth muscle tissues (aorta, muscular arteries, intestine, urinary bladder) with a 5-fold difference in maximal shortening velocity were obtained from mice and classified according to expression of the inserted myosin heavy chain (SMHC-B). Western blotting and quantitative PCR analyses were used to determine 15 metabolic and 8 cell signaling key components in each tissue. The slow muscle type (aorta) with a 12 times lower SMHC-B had 6-fold lower expression of the phosphatase subunit MYPT1, a 7-fold higher expression of Rhokinase 1, and a 3-fold higher expression of the PKC target CPI17, compared to the faster (urinary bladder) smooth muscle. The slow muscle had higher expression of components involved in glucose uptake and glycolysis (type 1 glucose transporter, 3 times; hexokinase, 13 times) and in gluconeogenesis (phosphoenolpyruvate carboxykinase, 43 times), but lower expression of the metabolic sensing AMP-activated kinase, alpha 2 isoform (5 times). The slow type also had higher expression of enzymes involved in lipid metabolism (hormone-sensitive lipase, 10 times; lipoprotein lipase, 13 times; fatty acid synthase, 6 times; type 2 acetyl-coenzyme A carboxylase, 8 times). We present a refined division of smooth muscle into muscle types based on the analysis of contractile, metabolic, and signaling components. Slow compared to fast smooth muscle has a lower expression of the deactivating phosphatase and upregulated Ca2+ sensitizing pathways and is more adapted for sustained glucose and lipid metabolism.
Keywords: Contractile kinetics; Energy metabolism; Myosin isoforms; Phasic; Shortening velocity; Tonic.
Figures


Similar articles
-
Myosin heavy chain isoform expression regulates shortening velocity in smooth muscle: studies using an SMB KO mouse line.J Muscle Res Cell Motil. 2004;25(2):149-58. doi: 10.1023/b:jure.0000035879.87045.4b. J Muscle Res Cell Motil. 2004. PMID: 15360130
-
Rapid activation by 3,5,3'-L-triiodothyronine of adenosine 5'-monophosphate-activated protein kinase/acetyl-coenzyme a carboxylase and akt/protein kinase B signaling pathways: relation to changes in fuel metabolism and myosin heavy-chain protein content in rat gastrocnemius muscle in vivo.Endocrinology. 2008 Dec;149(12):6462-70. doi: 10.1210/en.2008-0202. Epub 2008 Aug 14. Endocrinology. 2008. PMID: 18703632
-
Effects of thyroxine on myosin isoform expression and mechanical properties in guinea-pig smooth muscle.J Physiol. 2002 Sep 15;543(Pt 3):757-66. doi: 10.1113/jphysiol.2002.025494. J Physiol. 2002. PMID: 12231636 Free PMC article.
-
Signal-transduction pathways that regulate smooth muscle function I. Signal transduction in phasic (esophageal) and tonic (gastroesophageal sphincter) smooth muscles.Am J Physiol Gastrointest Liver Physiol. 2005 Mar;288(3):G407-16. doi: 10.1152/ajpgi.00398.2004. Am J Physiol Gastrointest Liver Physiol. 2005. PMID: 15701619 Review.
-
Regulatory role for the arginine-nitric oxide pathway in metabolism of energy substrates.J Nutr Biochem. 2006 Sep;17(9):571-88. doi: 10.1016/j.jnutbio.2005.12.001. Epub 2006 Jan 9. J Nutr Biochem. 2006. PMID: 16524713 Review.
Cited by
-
Locational and Directional Dependencies of Smooth Muscle Properties in Pig Urinary Bladder.Front Physiol. 2019 Feb 6;10:63. doi: 10.3389/fphys.2019.00063. eCollection 2019. Front Physiol. 2019. PMID: 30787883 Free PMC article.
-
Pharmacological and mechanical properties of isolated pig coronary veins.Front Physiol. 2023 Nov 2;14:1275736. doi: 10.3389/fphys.2023.1275736. eCollection 2023. Front Physiol. 2023. PMID: 38028806 Free PMC article.
References
-
- Atkins KB, Prezkop A, Park JL, Saha J, Duquaine D, Charron MJ, Olson AL, Brosius FC 3rd (2007) Preserved expression of GLUT4 prevents enhanced agonist-induced vascular reactivity and MYPT1 phosphorylation in hypertensive mouse aorta. Am J Physiol Heart Circ Physiol 293:H402–H408. 10.1152/ajpheart.00854.2006 - PubMed
Publication types
MeSH terms
Substances
Grants and funding
LinkOut - more resources
Full Text Sources
Other Literature Sources
Miscellaneous

