

Review
doi: 10.1111/bcp.13529.
Epub 2018 May 15.
Integrating data from the Investigational Medicinal Product Dossier/investigator's brochure. A new tool for translational integration of preclinical effects
Affiliations
- PMID: 29381216
- PMCID: PMC6005609
- DOI: 10.1111/bcp.13529
Item in Clipboard
Review
Integrating data from the Investigational Medicinal Product Dossier/investigator's brochure. A new tool for translational integration of preclinical effects
Br J Clin Pharmacol.
2018 Jul.
No abstract available
Keywords: Phase I; clinical trials; drug development, animal models; statistics and study design, methodology; toxicity; toxicology.
Figures
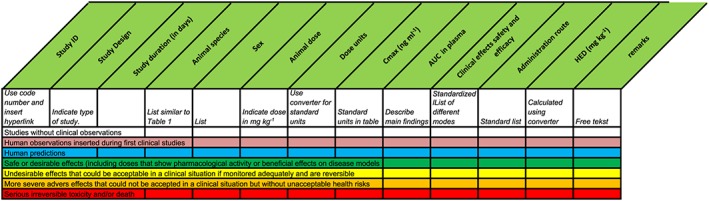
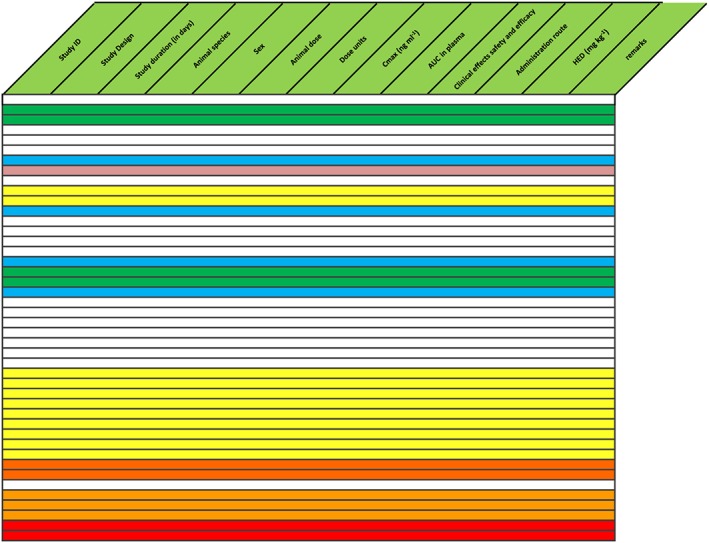
Basic structure of the spreadsheet with colour codes. AUC, area under the concentration curve; Cmax, maximum plasma drug concentration; HED, human equivalent dose
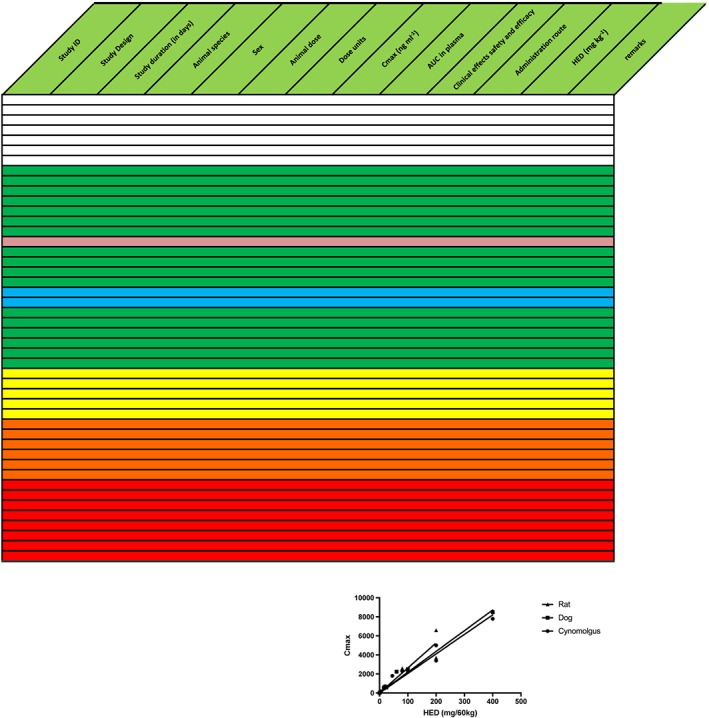
Example of a well‐behaved translatable compound, sorted on maximum plasma drug concentration (Cmax). Text in the table is omitted for clarity. Results are randomly mixed across species. For top to bottom, colours gradually change from predominantly blank (no effect) in lowest concentration range through green (pharmacologically or therapeutically desirable) to yellow–orange (increasingly severe reversible adverse effects) and red (irreversible toxicity and death). The anticipated effective human dose (blue) is in the same region as other green preclinical experiments. An overview with this colour distribution will provide the investigator with confidence that there are no significant differences across species, and that it is possible to determine a reliable safe starting dose for the first study in humans. The reliability is increased by the fact that three species demonstrate the same Cmax
vs. human equivalent dose (HED) relationship. (inset) The accuracy of the predictions can be checked during the first‐in‐human studies, by inserting the actual results. AUC, area under the concentration curve
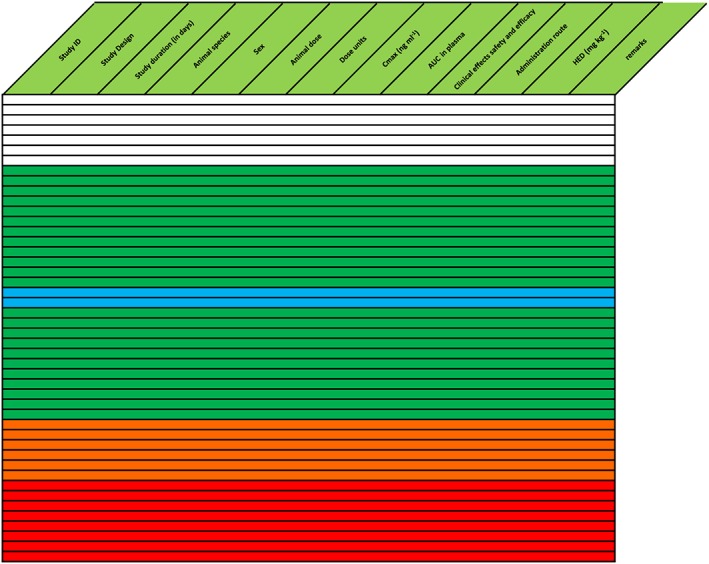
Compound without yellow tolerable side effects, signifying a steep concentration‐effect relationship with a limited safety margin if dose escalation is based on symptoms. Text in the table is omitted for clarity. There is a larger safety margin for the anticipated effective dose in humans, which can potentially be managed by careful rolling assessment of relevant pharmacological activity during first‐in‐man studies. The compound was safely administered to humans, based on measures of pharmacological activity and safety that were rapidly analysed and used for dose‐escalation decisions. AUC, area under the concentration curve; Cmax, maximum plasma drug concentration; HED, human equivalent dose
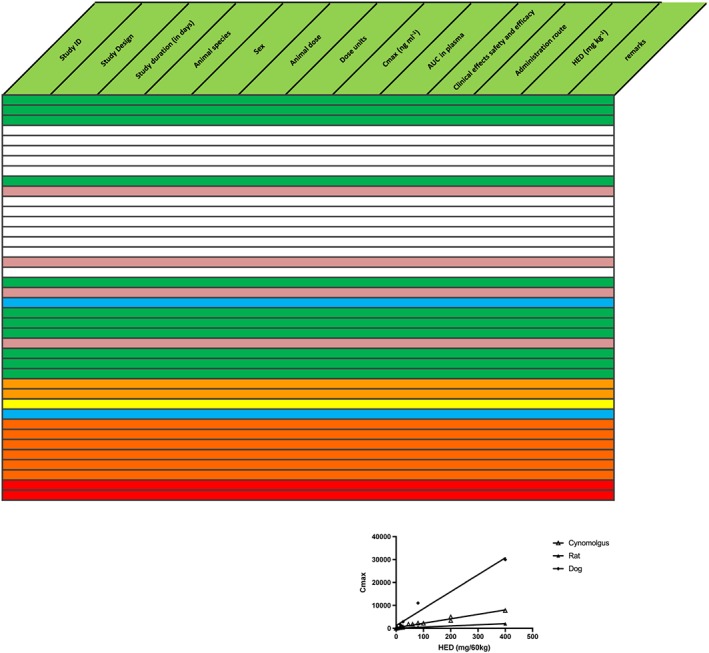
Discrepancy between animal model (lower blue row) and human predictions (upper blue row); possibly indicative of incorrect prediction by the model. Text in the table is omitted for clarity. Additionally, the relationship between maximum plasma drug concentration (Cmax) and human equivalent dose (HED) varies considerably between species, thus inducing further uncertainty about predictions (inset). Product was abandoned. AUC, area under the concentration curve

Reduction of safety margin caused by unexpected toxicity findings at drug concentrations slightly above therapeutic levels (red rows). Text in the table is omitted for clarity. This indicated possible species‐specific toxicity, which might have been derisked by elucidation of mechanism of action. Instead, it was decided to stop further development. The compound was not administered to humans. AUC, area under the concentration curve; Cmax, maximum plasma drug concentration; HED, human equivalent dose
Drug with efficacy at very low levels, but lowest part of concentration‐effect curve was not examined preclinically (no white experiments above green). Text in the table is omitted for clarity. After insertion of studies in humans (pink), effective dose range was found to be lower than predicted. Additional studies were performed in humans in a range 1/20–1/8 of the starting dose in original first‐in‐human study, which showed clear pharmacological effects without adverse effects. AUC, area under the concentration curve; Cmax, maximum plasma drug concentration; HED, human equivalent dose
References
-
- Kerbrat A, Ferré JC, Fillatre P, Ronzière T, Vannier S, Carsin‐Nicol B, et al Acute neurologic disorder from an inhibitor of fatty acid amide hydrolase. N Engl J Med 2016; 375: 1717–1725. - PubMed
-
- Kenter M, Cohen A. Establishing risk of human experimentation with drugs: lessons from TGN1412. Lancet 2006; 368: 1387–1391. - PubMed
-
- Cohen AF. Developing drug prototypes: pharmacology replaces safety and tolerability? Nat Rev Drug Discov 2010; 9: 856–865. - PubMed
-
- International Conference on Harmonisation of Technical Requirements for Registration of Pharmaceuticals for Human Use . Guideline for good clinical practice E6. 1996; Available at: http://www.ich.org/products/guidelines/efficacy/article/efficacy-guideli... (last accessed 1 April 2018).
Publication types
MeSH terms
Substances
LinkOut - more resources
Full Text Sources
Other Literature Sources
