. 2018 Jan 30;14(1):e1005953.
doi: 10.1371/journal.pcbi.1005953. eCollection 2018 Jan.

SozRank: A new approach for localizing the epileptic seizure onset zone

Affiliations

SozRank: A new approach for localizing the epileptic seizure onset zone

Yonathan Murin et al. PLoS Comput Biol. .

Abstract

Epilepsy is one of the most common neurological disorders affecting about 1% of the world population. For patients with focal seizures that cannot be treated with antiepileptic drugs, the common treatment is a surgical procedure for removal of the seizure onset zone (SOZ). In this work we introduce an algorithm for automatic localization of the seizure onset zone (SOZ) in epileptic patients based on electrocorticography (ECoG) recordings. The proposed algorithm builds upon the hypothesis that the abnormal excessive (or synchronous) neuronal activity in the brain leading to seizures starts in the SOZ and then spreads to other areas in the brain. Thus, when this abnormal activity starts, signals recorded at electrodes close to the SOZ should have a relatively large causal influence on the rest of the recorded signals. The SOZ localization is executed in two steps. First, the algorithm represents the set of electrodes using a directed graph in which nodes correspond to recording electrodes and the edges' weights quantify the pair-wise causal influence between the recorded signals. Then, the algorithm infers the SOZ from the estimated graph using a variant of the PageRank algorithm followed by a novel post-processing phase. Inference results for 19 patients show a close match between the SOZ inferred by the proposed approach and the SOZ estimated by expert neurologists (success rate of 17 out of 19).


Conflict of interest statement

The authors have declared that no competing interests exist.

Figures

Fig 1
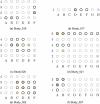
Fig 1. Localization results for data-sets I001_P034_D01 to Study_010.
The EOI nodes are marked by a bold annulus, whereas the nodes detected by our proposed algorithm are marked by solid brown circles. (a) (Top left) Localization results for data-set I001_P034_D01. This is a successful localization, with Vp = 0. Note that in in this data-set, even though node 6A–6B are mentioned in the report, their recordings are missing from the data-set. (b) (Top right) Localization results for data-set Study_004-2. This is a successful localization, with Vp = 0. (c) (Bottom left) Localization results for data-set Study_006. This is a successful localization, with Vp = 0.069. (d) (Bottom right) Localization results for data-set Study_010. This is a successful localization, with Vp = 0.071.
Fig 2
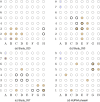
Fig 2. Localization results for data-sets Study_016 to Study_027.
The EOI nodes are marked by a bold annulus, whereas the nodes detected by our proposed algorithm are marked by solid brown circles. (a) (Top left) Localization results for data-set Study_016. This is a successful localization, with Vp = 0.064. (b) (Top right) Localization results for data-set Study_017. This is a successful localization, with Vp = 0. (c) (Middle left) Localization results for data-set Study_020. This is a successful localization, with Vp = 0. (d) (Middle right) Localization results for data-set Study_021. This is a successful localization, with Vp = 0. (e) (Bottom left) Localization results for data-set Study_022. This is a successful localization, with Vp = 0. (f) (Bottom right) Localization results for data-set Study_027. This is a successful localization, with Vp = 0.
Fig 3
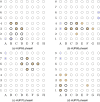
Fig 3. Localization results for data-sets Study_023 to HUP64_phaseII.
The EOI nodes are marked by a bold annulus, whereas the nodes detected by our proposed algorithm are marked by solid brown circles. (a) (Top left) Localization results for data-set Study_023. This is a non-successful localization, with Vp = 0.143. (b) (Top right) Localization results for data-set Study_033. This is a successful localization, with Vp = 0.02. (c) (Bottom left) Localization results for data-set Study_037. This is a successful localization, with Vp = 0.051. (d) (Bottom right) Localization results for data-set HUP64_phaseII. This is a non-successful localization, with Vp = 0.071.
Fig 4
Fig 4. Localization results for data-sets HUP65_phaseII to HUP78_phaseII.
The EOI nodes are marked by a bold annulus, whereas the nodes detected by our proposed algorithm are marked by solid brown circles. (a) (Top left) Localization results for data-set HUP65_phaseII. This is a successful localization, with Vp = 0. (b) (Top right) Localization results for data-set HUP65_phaseII. This is a successful localization, with Vp = 0. (c) (Bottom left) Localization results for data-set HUP70_phaseII. This is a successful localization, with Vp = 0. (d) (Bottom right) Localization results for data-set HUP78_phaseII. This is a successful localization, with Vp = 0.053.
Fig 5
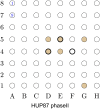
Fig 5. Localization results for data-set HUP87_phaseII.
The EOI nodes are marked by a bold annulus, whereas the nodes detected by our proposed algorithm are marked by solid brown circles. This is a successful localization, with Vp = 0.037.
Fig 6
Fig 6. Heat maps illustrating the estimated causal influence graph for data-sets HUP65_phaseII and HUP70_phaseII.
The left column corresponds to the first 10 seconds in the ictal blocks, while the two right columns correspond to two random 10 seconds rest blocks. (a)-(c) Heat maps of data set HUP65_phaseII. (d)-(f) Heat maps of data set HUP70_phaseII.
Fig 7
Fig 7. Heat maps illustrating the estimated causal influence graph for data-sets HUP78_phaseII and HUP87_phaseII.
The left column corresponds to the first 10 seconds in the ictal blocks, while the two right columns correspond to two random 10 seconds rest blocks. (a)-(c) Heat maps of data set HUP78_phaseII. (d)-(f) Heat maps of data set HUP87_phaseII.
Fig 8
Fig 8. Heat maps illustrating the estimated causal influence graph for data-set HUP65_phaseII in different time intervals.
(a) Heat map of the causal influence graph estimated from a rest block. (b) Heat map of the causal influence graph estimated from 10 seconds before a seizure (pre-ictal block). (c) Heat map of the causal influence graph estimated from a 10 seconds at the beginning of a seizure (ictal block). (d) Heat map of the causal influence graph estimated from 10-20 seconds after the beginning of a seizure. (e) Heat map of the causal influence graph estimated from 20-30 seconds after the beginning of a seizure. (f) Heat maps of the causal influence graph estimated from 30-40 seconds after the beginning of a seizure.
Fig 9
Fig 9. High-level block diagram of the proposed algorithm.
SDI and SGC are the inferences (set of electrodes) from the DI-Graph and the GC-Graph, respectively; ϕ denotes the empty set; and S is the final set of inferred electrodes.
Fig 10
Fig 10. Exemplary recorded signals for data-set Study_016.
The sampling rate is 500 Hz, while the block length is 10 seconds. (a) An ictal block. (b) A (randomly sampled) rest block.
Fig 11
Fig 11. A block diagram of the procedure for calculating SDI (or SGC).
Victal is a 10 ⋅ Fs × N matrix of the ECoG recordings; X is a matrix of the pre-processing output; G is the estimated causal-influence graph (of size N × N); s is the vector of scores generated by the (variant of the) PageRank ranking process; Vrest is a 2000 ⋅ Fs × N matrix used to create the empirical distributions; and, S is a set of electrodes inferred to be the SOZ.
Fig 12
Fig 12. Ilustration of the the procedure for generating the empirical distributions for each node.
s^j,j=1,2,,N, denotes the empirical distribution of the jth node.

References

    1. Fisher RS, v Emde Boas W, Blume W, Elger C, Genton P, Lee P, et al. Epileptic seizures and epilepsy: definitions proposed by the International League Against Epilepsy (ILAE) and the International Bureau for Epilepsy (IBE). Epilepsia. 2005;46(4):470–472. doi: 10.1111/j.0013-9580.2005.66104.x - DOI - PubMed
    1. van Mierlo P, Papadopoulou M, Carrette E, Boon P, Vandenberghe S, Vonck K, et al. Functional brain connectivity from EEG in epilepsy: Seizure prediction and epileptogenic focus localization. Progress in Neurobiology. 2014;121:19–35. doi: 10.1016/j.pneurobio.2014.06.004 - DOI - PubMed
    1. Yaffe RB, Borger P, Megevand P, Groppe AM, Kramer MA, Chu CJ, et al. Physiology of functional and effective networks in epilepsy. Clinical Neurophysiology. 2015;126:227–236. doi: 10.1016/j.clinph.2014.09.009 - DOI - PubMed
    1. Duncan JS, Sander JW, Sisodiya SM, Walker MC. Adult epilepsy. The Lancet. 2007;367(9516):1087–1100. doi: 10.1016/S0140-6736(06)68477-8 - DOI - PubMed
    1. Rosenow F, Luders H. Presurgical evaluation of epilepsy. Brain. 2001; p. 1683–1700. doi: 10.1093/brain/124.9.1683 - DOI - PubMed

Publication types

Substances