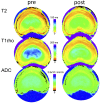
Quantitative MRI in early intervertebral disc degeneration: T1rho correlates better than T2 and ADC with biomechanics, histology and matrix content
- PMID: 29381716
- PMCID: PMC5790235
- DOI: 10.1371/journal.pone.0191442
Quantitative MRI in early intervertebral disc degeneration: T1rho correlates better than T2 and ADC with biomechanics, histology and matrix content
Abstract
Introduction: Low-back pain (LBP) has been correlated to the presence of intervertebral disc (IVD) degeneration on T2-weighted (T2w) MRI. It remains challenging, however, to accurately stage degenerative disc disease (DDD) based on T2w MRI and measurements of IVD height, particularly for early DDD. Several quantitative MRI techniques have been introduced to detect changes in matrix composition signifying early DDD. In this study, we correlated quantitative T2, T1rho and Apparent Diffusion Coefficient (ADC) values to disc mechanical behavior and gold standard early DDD markers in a graded degenerated lumbar IVD caprine model, to assess their potential for early DDD detection.
Methods: Lumbar caprine IVDs were injected with either 0.25 U/ml or 0.5 U/ml Chondroïtinase ABC (Cabc) to trigger early DDD-like degeneration. Injection with phosphate-buffered saline (PBS) served as control. IVDs were cultured in a bioreactor for 20 days under axial physiological loading. High-resolution 9.4 T MR images were obtained prior to intervention and after culture. Quantitative MR results were correlated to recovery behavior, histological degeneration grading, and the content of glycosaminoglycans (GAGs) and water.
Results: Cabc-injected IVDs showed aberrancies in biomechanics and loss of GAGs without changes in water-content. All MR sequences detected changes in matrix composition, with T1rho showing largest changes pre-to-post in the nucleus, and significantly more than T2 and ADC. Histologically, degeneration due to Cabc injection was mild. T1rho nucleus values correlated strongest with altered biomechanics, histological degeneration score, and loss of GAGs.
Conclusions: T2- and T1rho quantitative MR-mapping detected early DDD changes. T1rho nucleus values correlated better than T2 and ADC with biomechanical, histological, and GAG changes. Clinical implementation of quantitative MRI, T1rho particularly, could aid in distinguishing DDD more reliably at an earlier stage in the degenerative process.
Conflict of interest statement
Figures


Similar articles
-
Changes in Intervertebral Disk Mechanical Behavior During Early Degeneration.J Biomech Eng. 2018 Sep 1;140(9). doi: 10.1115/1.4039890. J Biomech Eng. 2018. PMID: 29801164
-
Axial T1ρ MRI as a diagnostic imaging modality to quantify proteoglycan concentration in degenerative disc disease.Eur Spine J. 2015 Nov;24(11):2395-401. doi: 10.1007/s00586-014-3582-6. Epub 2014 Sep 19. Eur Spine J. 2015. PMID: 25236594 Free PMC article.
-
Correlations between quantitative T2 and T1ρ MRI, mechanical properties and biochemical composition in a rabbit lumbar intervertebral disc degeneration model.J Orthop Res. 2016 Aug;34(8):1382-8. doi: 10.1002/jor.23269. Epub 2016 Aug 10. J Orthop Res. 2016. PMID: 27105019 Free PMC article.
-
Novel imaging of the intervertebral disk and pain.Global Spine J. 2013 Jun;3(3):127-32. doi: 10.1055/s-0033-1347930. Epub 2013 May 30. Global Spine J. 2013. PMID: 24436863 Free PMC article. Review.
-
Imaging Evaluation of Intervertebral Disc Degeneration and Painful Discs-Advances and Challenges in Quantitative MRI.Diagnostics (Basel). 2022 Mar 14;12(3):707. doi: 10.3390/diagnostics12030707. Diagnostics (Basel). 2022. PMID: 35328260 Free PMC article. Review.
Cited by
-
An Automatized Deep Segmentation and Classification Model for Lumbar Disk Degeneration and Clarification of Its Impact on Clinical Decisions.Global Spine J. 2025 Mar;15(2):554-563. doi: 10.1177/21925682231200783. Epub 2023 Sep 12. Global Spine J. 2025. PMID: 37698081 Free PMC article.
-
Does Calcium Phosphate Cement Kyphoplasty Cause Intervertebral Disk Degeneration in Adolescents?Cartilage. 2022 Dec;13(4):77-86. doi: 10.1177/19476035221126354. Epub 2022 Oct 18. Cartilage. 2022. PMID: 36254621 Free PMC article.
-
A novel magnetic resonance imaging postprocessing technique for the assessment of intervertebral disc degeneration-Correlation with histological grading in a rabbit disc degeneration model.JOR Spine. 2019 Aug 1;2(3):e1060. doi: 10.1002/jsp2.1060. eCollection 2019 Sep. JOR Spine. 2019. PMID: 31572977 Free PMC article.
-
Quantitative assessment of rotator cuff injuries using synthetic MRI and IDEAL-IQ imaging techniques.Heliyon. 2024 Sep 4;10(17):e37307. doi: 10.1016/j.heliyon.2024.e37307. eCollection 2024 Sep 15. Heliyon. 2024. PMID: 39296233 Free PMC article.
-
Twenty years of 'insanity' in diagnosing underlying clinically relevant cervical dysfunction using traditional MRI.J Spine Surg. 2018 Sep;4(3):658-659. doi: 10.21037/jss.2018.07.10. J Spine Surg. 2018. PMID: 30547133 Free PMC article. No abstract available.
References
-
- Katz JN. Lumbar disc disorders and low-back pain: socioeconomic factors and consequences. J Bone Joint Surg Am. 2006;88 Suppl 2:21–4. - PubMed
-
- Murray CJ, Vos T, Lozano R, Naghavi M, Flaxman AD, Michaud C, et al. Disability-adjusted life years (DALYs) for 291 diseases and injuries in 21 regions, 1990–2010: a systematic analysis for the Global Burden of Disease Study 2010. Lancet. 2012;380(9859):2197–223. doi: 10.1016/S0140-6736(12)61689-4 - DOI - PubMed
-
- Luoma K, Riihimaki H, Luukkonen R, Raininko R, Viikari-Juntura E, Lamminen A. Low back pain in relation to lumbar disc degeneration. Spine (Phila Pa 1976). 2000;25(4):487–92. - PubMed
-
- Teraguchi M, Yoshimura N, Hashizume H, Muraki S, Yamada H, Minamide A, et al. Prevalence and distribution of intervertebral disc degeneration over the entire spine in a population-based cohort: the Wakayama Spine Study. Osteoarthritis and cartilage. 2014;22(1):104–10. Epub 2013/11/19. doi: 10.1016/j.joca.2013.10.019 . - DOI - PubMed
-
- Cheung KM, Karppinen J, Chan D, Ho DW, Song YQ, Sham P, et al. Prevalence and pattern of lumbar magnetic resonance imaging changes in a population study of one thousand forty-three individuals. Spine. 2009;34(9):934–40. Epub 2009/06/18. doi: 10.1097/BRS.0b013e3181a01b3f . - DOI - PubMed
Publication types
MeSH terms
Substances
LinkOut - more resources
Full Text Sources
Other Literature Sources
Medical
Research Materials
Miscellaneous

