

Early-Life Iron Deficiency Reduces Brain Iron Content and Alters Brain Tissue Composition Despite Iron Repletion: A Neuroimaging Assessment
- PMID: 29382055
- PMCID: PMC5852711
- DOI: 10.3390/nu10020135
Early-Life Iron Deficiency Reduces Brain Iron Content and Alters Brain Tissue Composition Despite Iron Repletion: A Neuroimaging Assessment
Abstract
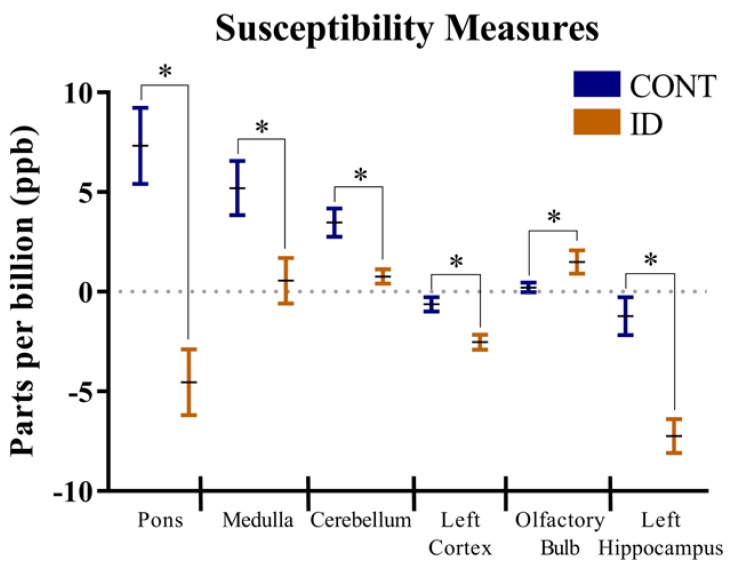
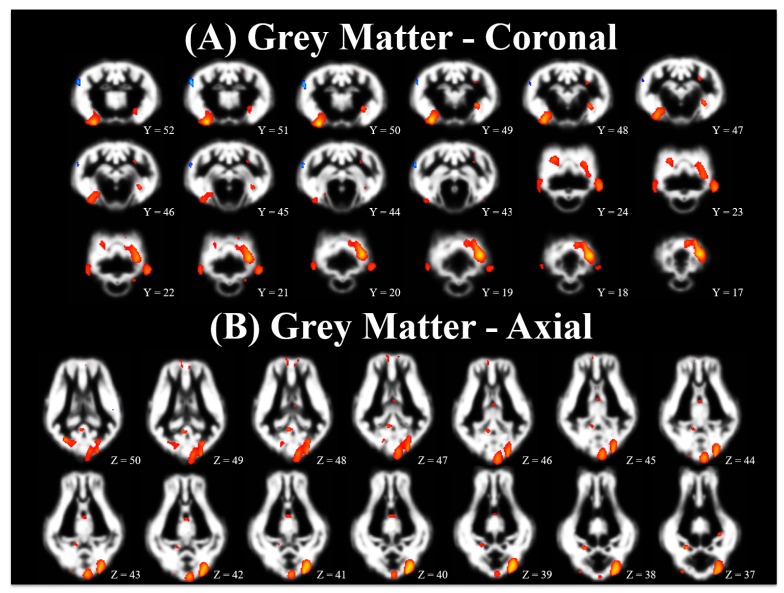
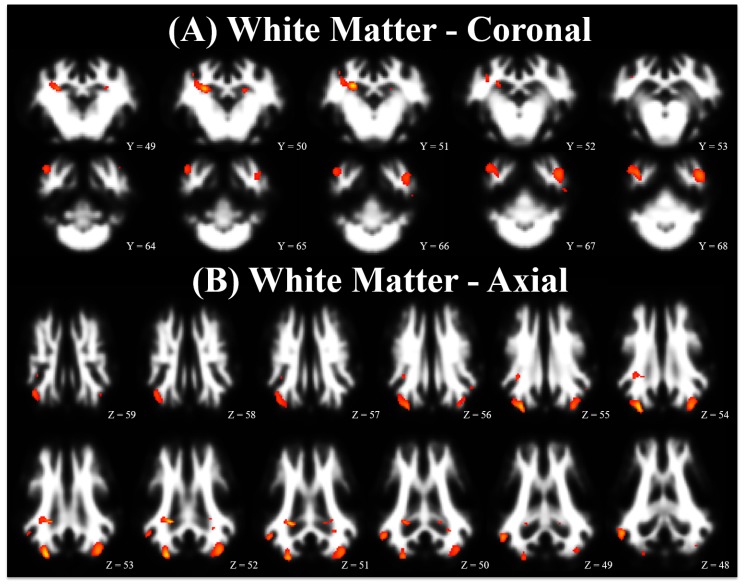
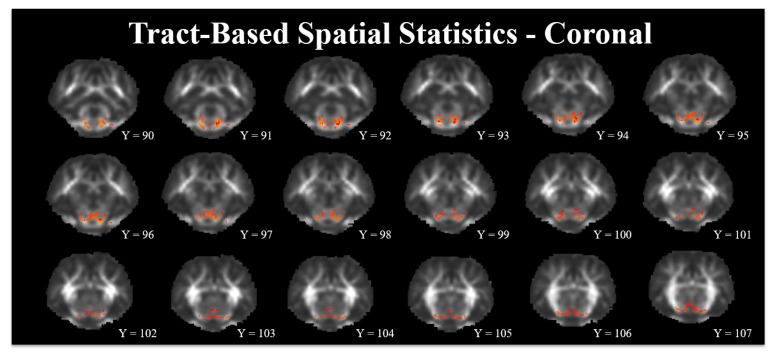
Early-life iron deficiency has lifelong influences on brain structure and cognitive function, however characterization of these changes often requires invasive techniques. There is a need for non-invasive assessment of early-life iron deficiency with potential to translate findings to the human clinical setting. In this study, 28 male pigs were provided either a control diet (CONT; n = 14; 23.5 mg Fe/L milk replacer) or an iron-deficient diet (ID; n = 14; 1.56 mg Fe/L milk replacer) for phase 1 of the study, from postnatal day (PND) 2 until 32. Twenty pigs (n = 10/diet from phase 1 were used in phase 2 of the study from PND 33 to 61, where all pigs were provided a common iron-sufficient diet, regardless of their phase 1 dietary iron status. All pigs were subjected to magnetic resonance imaging at PND 32 and again at PND 61, and quantitative susceptibility mapping was used to assess brain iron content at both imaging time-points. Data collected on PND 61 were analyzed using voxel-based morphometry and tract-based spatial statistics to determine tissue concentration difference and white matter tract integrity, respectively. Quantitative susceptibility mapping outcomes indicated reduced iron content in the pons, medulla, cerebellum, left cortex, and left hippocampus of ID pigs compared with CONT pigs, regardless of imaging time-point. In contrast, iron contents were increased in the olfactory bulbs of ID pigs compared with CONT pigs. Voxel-based morphometric analysis indicated increased grey and white matter concentrations in CONT pigs compared with ID pigs that were evident at PND 61. Differences in tissue concentrations were predominately located in cortical tissue as well as the cerebellum, thalamus, caudate, internal capsule, and hippocampi. Tract-based spatial statistics indicated increased fractional anisotropy values along subcortical white matter tracts in CONT pigs compared with ID pigs that were evident on PND 61. All described differences were significant at p ≤ 0.05. Results from this study indicate that neuroimaging can sensitively detect structural and physiological changes due to early-life iron deficiency, including grey and white matter volumes, iron contents, as well as reduced subcortical white matter integrity, despite a subsequent period of dietary iron repletion.
Keywords: brain iron; iron deficiency; iron repletion; myelination; neurodevelopment; pediatric nutrition; pig.
Conflict of interest statement
The authors declare no conflict of interest.
Figures
Similar articles
-
Dietary Iron Repletion following Early-Life Dietary Iron Deficiency Does Not Correct Regional Volumetric or Diffusion Tensor Changes in the Developing Pig Brain.Front Neurol. 2018 Jan 11;8:735. doi: 10.3389/fneur.2017.00735. eCollection 2017. Front Neurol. 2018. PMID: 29375469 Free PMC article.
-
Longitudinal Effects of Iron Deficiency Anemia and Subsequent Repletion on Blood Parameters and the Rate and Composition of Growth in Pigs.Nutrients. 2018 May 17;10(5):632. doi: 10.3390/nu10050632. Nutrients. 2018. PMID: 29772815 Free PMC article.
-
Early-Life Iron Deficiency and Subsequent Repletion Alters Development of the Colonic Microbiota in the Pig.Front Nutr. 2019 Aug 7;6:120. doi: 10.3389/fnut.2019.00120. eCollection 2019. Front Nutr. 2019. PMID: 31440513 Free PMC article.
-
Advanced structural neuroimaging in progressive supranuclear palsy: Where do we stand?Parkinsonism Relat Disord. 2017 Mar;36:19-32. doi: 10.1016/j.parkreldis.2016.12.023. Epub 2016 Dec 26. Parkinsonism Relat Disord. 2017. PMID: 28057431 Review.
-
Why iron deficiency is important in infant development.J Nutr. 2008 Dec;138(12):2534-6. doi: 10.1093/jn/138.12.2534. J Nutr. 2008. PMID: 19022985 Free PMC article. Review.
Cited by
-
Maternal Iron Deficiency and Environmental Lead (Pb) Exposure Alter the Predictive Value of Blood Pb Levels on Brain Pb Burden in the Offspring in a Dietary Mouse Model: An Important Consideration for Cumulative Risk in Development.Nutrients. 2023 Sep 22;15(19):4101. doi: 10.3390/nu15194101. Nutrients. 2023. PMID: 37836385 Free PMC article.
-
Trace metals and animal health: Interplay of the gut microbiota with iron, manganese, zinc, and copper.Anim Nutr. 2021 Sep;7(3):750-761. doi: 10.1016/j.aninu.2021.03.005. Epub 2021 Jun 17. Anim Nutr. 2021. PMID: 34466679 Free PMC article. Review.
-
Brain Iron Metabolism, Redox Balance and Neurological Diseases.Antioxidants (Basel). 2023 Jun 16;12(6):1289. doi: 10.3390/antiox12061289. Antioxidants (Basel). 2023. PMID: 37372019 Free PMC article. Review.
-
Effects of Daily Iron Supplementation on Motor Development and Brain Connectivity in Preterm Infants: A Diffusion Magnetic Resonance Study.Front Neurosci. 2021 Nov 8;15:769558. doi: 10.3389/fnins.2021.769558. eCollection 2021. Front Neurosci. 2021. PMID: 34819836 Free PMC article.
-
Associations Between Lifetime Histories of Iron Deficiency, Anxiety, Depression and Multiple Pain Conditions: An Observational Study Using a Large-Scale National Database.J Pain Res. 2025 Jul 30;18:3781-3792. doi: 10.2147/JPR.S497122. eCollection 2025. J Pain Res. 2025. PMID: 40756431 Free PMC article.
References
-
- World Health Organization . Micronutrient Deficiencies—Iron Deficiency Anemia. World Health Organization; Geneva, Switzerland: 2017.
-
- World Health Organization . Iron Deficiency Anaemia: Assessment, Prevention, and Control: A Guide for Programme Managers. World Health Organization; Geneva, Switzerland: 2010.
MeSH terms
Substances
LinkOut - more resources
Full Text Sources
Other Literature Sources
