

Inferring synteny between genome assemblies: a systematic evaluation
- PMID: 29382321
- PMCID: PMC5791376
- DOI: 10.1186/s12859-018-2026-4
Inferring synteny between genome assemblies: a systematic evaluation
Abstract
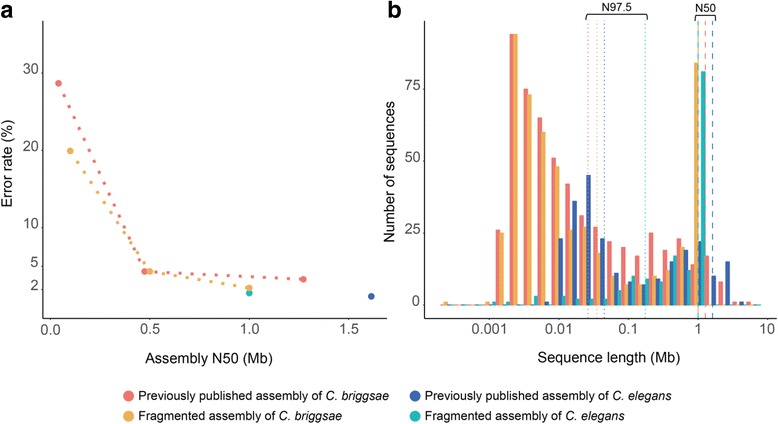
Background: Genome assemblies across all domains of life are being produced routinely. Initial analysis of a new genome usually includes annotation and comparative genomics. Synteny provides a framework in which conservation of homologous genes and gene order is identified between genomes of different species. The availability of human and mouse genomes paved the way for algorithm development in large-scale synteny mapping, which eventually became an integral part of comparative genomics. Synteny analysis is regularly performed on assembled sequences that are fragmented, neglecting the fact that most methods were developed using complete genomes. It is unknown to what extent draft assemblies lead to errors in such analysis.
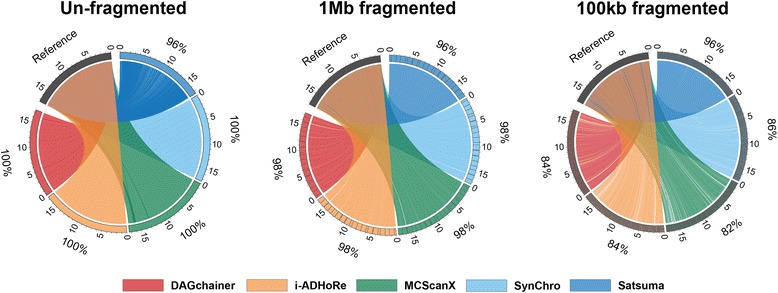
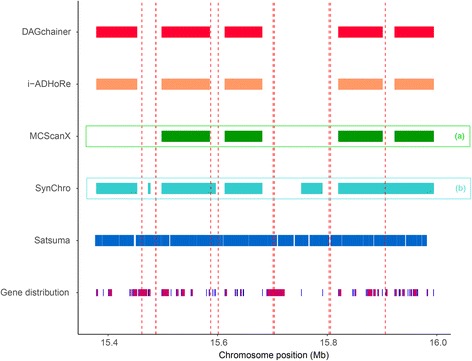
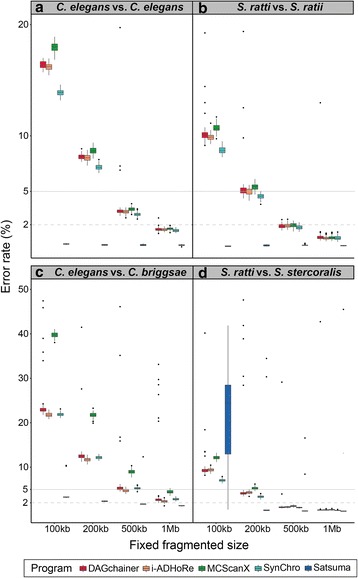
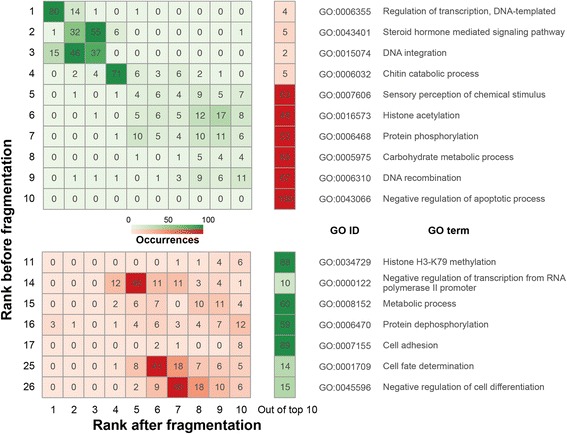
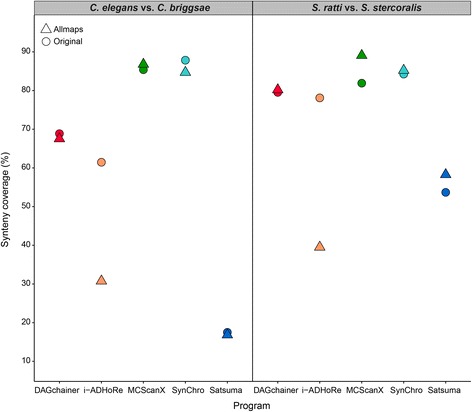
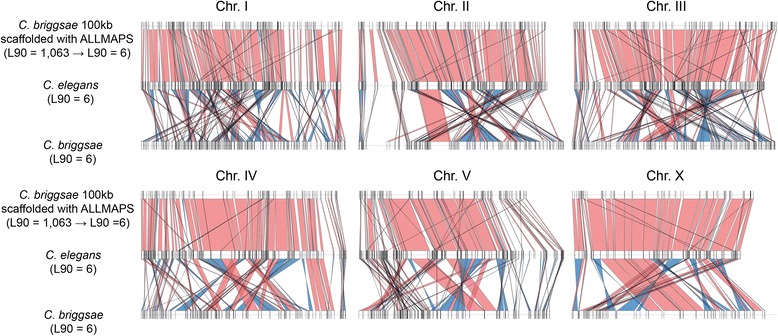
Results: We fragmented genome assemblies of model nematodes to various extents and conducted synteny identification and downstream analysis. We first show that synteny between species can be underestimated up to 40% and find disagreements between popular tools that infer synteny blocks. This inconsistency and further demonstration of erroneous gene ontology enrichment tests raise questions about the robustness of previous synteny analysis when gold standard genome sequences remain limited. In addition, assembly scaffolding using a reference guided approach with a closely related species may result in chimeric scaffolds with inflated assembly metrics if a true evolutionary relationship was overlooked. Annotation quality, however, has minimal effect on synteny if the assembled genome is highly contiguous.
Conclusions: Our results show that a minimum N50 of 1 Mb is required for robust downstream synteny analysis, which emphasizes the importance of gold standard genomes to the science community, and should be achieved given the current progress in sequencing technology.
Keywords: Assembly quality; Comparative genomics; Genome synteny; Nematode genomes.
Conflict of interest statement
Ethics approval and consent to participate
Not applicable.
Consent for publication
Not applicable.
Competing interests
The authors declare that they have no competing interests.
Publisher’s Note
Springer Nature remains neutral with regard to jurisdictional claims in published maps and institutional affiliations.
Figures
Similar articles
-
Evolutionary superscaffolding and chromosome anchoring to improve Anopheles genome assemblies.BMC Biol. 2020 Jan 2;18(1):1. doi: 10.1186/s12915-019-0728-3. BMC Biol. 2020. PMID: 31898513 Free PMC article.
-
Visualizing genomic evolution in Caenorhabditis through WormSynteny.BMC Genomics. 2024 Oct 28;25(1):1009. doi: 10.1186/s12864-024-10919-6. BMC Genomics. 2024. PMID: 39468698 Free PMC article.
-
Large synteny blocks revealed between Caenorhabditis elegans and Caenorhabditis briggsae genomes using OrthoCluster.BMC Genomics. 2010 Sep 24;11:516. doi: 10.1186/1471-2164-11-516. BMC Genomics. 2010. PMID: 20868500 Free PMC article.
-
Haemonchus contortus: Genome Structure, Organization and Comparative Genomics.Adv Parasitol. 2016;93:569-98. doi: 10.1016/bs.apar.2016.02.016. Epub 2016 Apr 11. Adv Parasitol. 2016. PMID: 27238013 Review.
-
How to usefully compare homologous plant genes and chromosomes as DNA sequences.Plant J. 2008 Feb;53(4):661-73. doi: 10.1111/j.1365-313X.2007.03326.x. Plant J. 2008. PMID: 18269575 Review.
Cited by
-
Genome-wide identification, structural and gene expression analysis of BTB gene family in soybean.BMC Plant Biol. 2024 Jul 11;24(1):663. doi: 10.1186/s12870-024-05365-1. BMC Plant Biol. 2024. PMID: 38992596 Free PMC article.
-
Genomics Research on the Road of Studying Biology and Virulence of Cereal Rust Fungi.Mol Plant Pathol. 2025 Apr;26(4):e70082. doi: 10.1111/mpp.70082. Mol Plant Pathol. 2025. PMID: 40181494 Free PMC article. Review.
-
Genome-wide identification and characterization of flowering genes in Citrus sinensis (L.) Osbeck: a comparison among C. Medica L., C. Reticulata Blanco, C. Grandis (L.) Osbeck and C. Clementina.BMC Genom Data. 2024 Feb 20;25(1):20. doi: 10.1186/s12863-024-01201-5. BMC Genom Data. 2024. PMID: 38378481 Free PMC article.
-
Genome and pan-genome analysis to classify emerging bacteria.Biol Direct. 2019 Feb 26;14(1):5. doi: 10.1186/s13062-019-0234-0. Biol Direct. 2019. PMID: 30808378 Free PMC article. Review.
-
A Comprehensive Study of the WRKY Transcription Factor Family in Strawberry.Plants (Basel). 2022 Jun 15;11(12):1585. doi: 10.3390/plants11121585. Plants (Basel). 2022. PMID: 35736736 Free PMC article.
References
-
- Iorizzo M, Ellison S, Senalik D, Zeng P, Satapoomin P, Huang J, Bowman M, Iovene M, Sanseverino W, Cavagnaro P, et al. A high-quality carrot genome assembly provides new insights into carotenoid accumulation and asterid genome evolution . Nat Genet. 2016;48:657–66. - PubMed
-
- Jarvis DE, Ho YS, Lightfoot DJ, Schmöckel SM, Li B, Borm TJA, Ohyanagi H, Mineta K, Michell CT, Saber N, et al. The genome of Chenopodium Quinoa. Nature. 2017;542:1-6. - PubMed
Publication types
MeSH terms
LinkOut - more resources
Full Text Sources
Other Literature Sources
Miscellaneous
