

The miR-181 family promotes cell cycle by targeting CTDSPL, a phosphatase-like tumor suppressor in uveal melanoma
- PMID: 29382357
- PMCID: PMC5791374
- DOI: 10.1186/s13046-018-0679-5
The miR-181 family promotes cell cycle by targeting CTDSPL, a phosphatase-like tumor suppressor in uveal melanoma
Abstract
Background: MicroRNAs (miRNAs) have been shown to function in many different cellular processes, including proliferation, apoptosis, differentiation and development. miR-181a, -181b, -181c and -181d are miR-181 members of the family, which has been rarely studied, especially uveal melanoma.
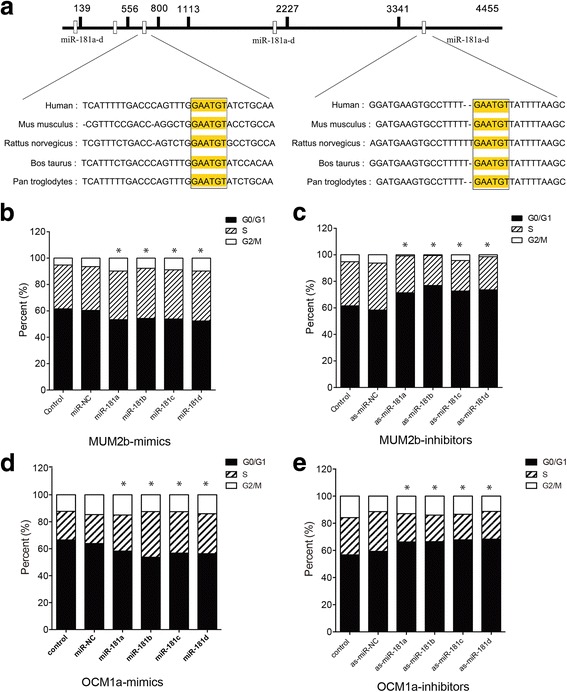
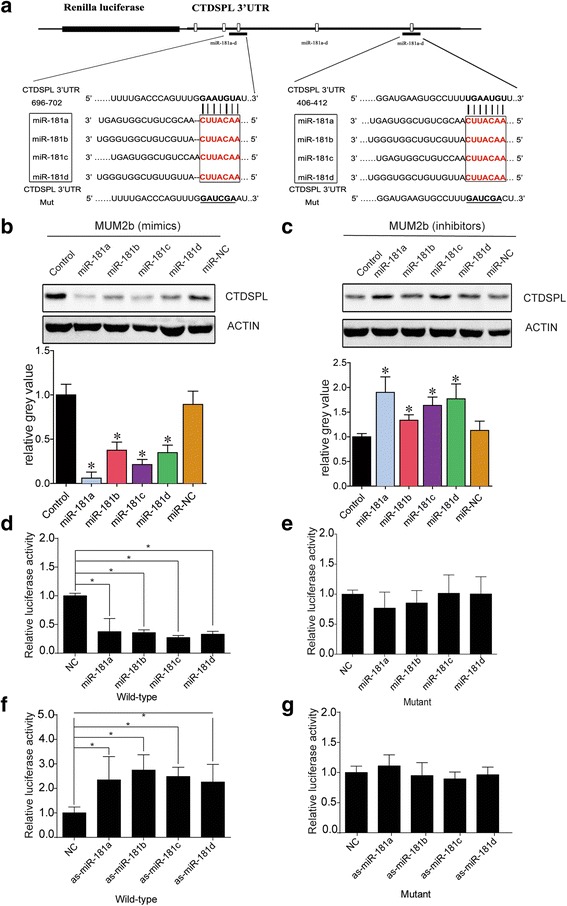
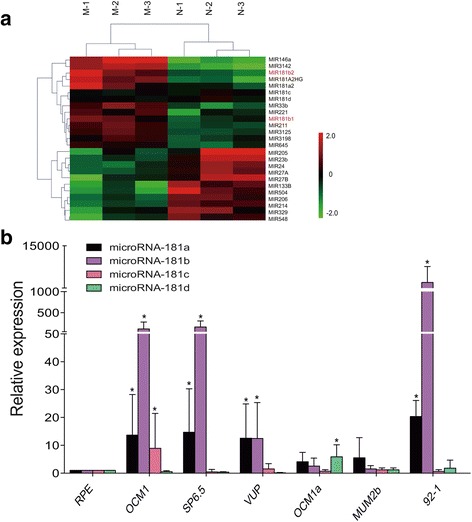
Methods: The expression level of miR-181 family in human uveal melanoma cell lines was measured via real-time PCR (RT-PCR). The function of miR-181 on cell cycle was detected through Flow Cytometry assay. Microarray assay and Bioinformatics analysis were used to find the potential target of miR-181b, and dual-luciferase reporter assays further identified the target gene.
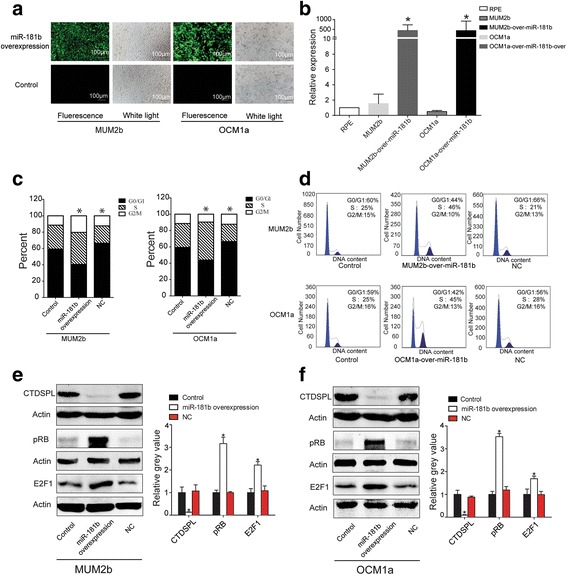
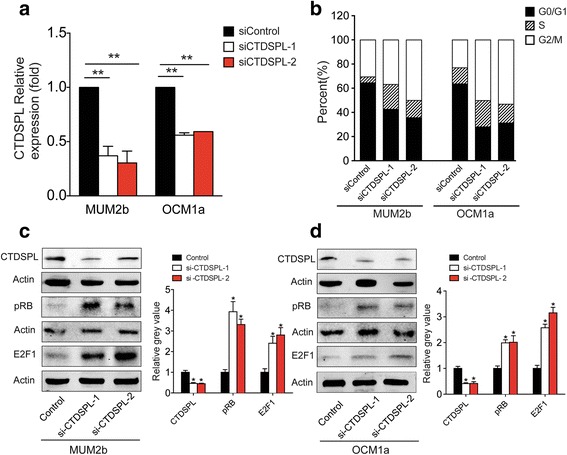
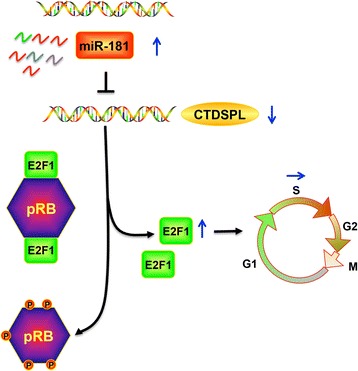
Results: MiR-181 family members were found to be highly homologous across different species and their upregulation significantly induces UM cell cycle progression. Of the family members, miR-181b was significantly overexpressed in UM tissues and most UM cells. Bioinformatics and dual luciferase reporter assay confirmed CTDSPL as a target of miR-181b. miR-181b over-expression inhibited CTDSPL expression, which in turn led to the phosphorylation of RB and an accumulation of the downstream cell cycle effector E2F1, promoting cell cycle progression in UM cells. Knockdown CTDSPL using siRNAs showing the same effect, including increase of E2F1 and the progression of cell cycle.
Conclusions: MiR-181 family members are key negative regulators of CTDSPL-mediated cell cycle progression. These results highlight that miR-181 family members, especially miR-181b, may be useful in the development of miRNA-based therapies and may serve as novel diagnostic and therapeutic candidate for UM.
Keywords: CTDSPL; Cell cycle; E2F1; Uveal melanoma; miR-181.
Conflict of interest statement
Ethics approval and consent to participate
All procedures performed in studies involving human participants were in accordance with the ethical standards of the Ethics Committee of the Institutional Ethical Review Board of Shanghai Ninth People’s Hospital. All patients studied signed an informed consent for participation.
Consent for publication
Not applicable.
Competing interests
The authors declare that they have no competing interests.
Publisher’s Note
Springer Nature remains neutral with regard to jurisdictional claims in published maps and institutional affiliations.
Figures
Similar articles
-
MicroRNA 145 may play an important role in uveal melanoma cell growth by potentially targeting insulin receptor substrate-1.Chin Med J (Engl). 2014;127(8):1410-6. Chin Med J (Engl). 2014. PMID: 24762580
-
Epigenetics, microRNAs, and carcinogenesis: functional role of microRNA-137 in uveal melanoma.Invest Ophthalmol Vis Sci. 2011 Mar 2;52(3):1193-9. doi: 10.1167/iovs.10-5272. Invest Ophthalmol Vis Sci. 2011. PMID: 21051724
-
miR-224-5p inhibits proliferation, migration, and invasion by targeting PIK3R3/AKT3 in uveal melanoma.J Cell Biochem. 2019 Aug;120(8):12412-12421. doi: 10.1002/jcb.28507. Epub 2019 Mar 1. J Cell Biochem. 2019. PMID: 30825222
-
MicroRNA dysregulation in uveal melanoma: a new player enters the game.Oncotarget. 2015 Mar 10;6(7):4562-8. doi: 10.18632/oncotarget.2923. Oncotarget. 2015. PMID: 25682876 Free PMC article. Review.
-
Emerging roles of microRNAs and their implications in uveal melanoma.Cell Mol Life Sci. 2021 Jan;78(2):545-559. doi: 10.1007/s00018-020-03612-w. Epub 2020 Aug 11. Cell Mol Life Sci. 2021. PMID: 32783068 Free PMC article. Review.
Cited by
-
MiR-520a-5p/PPP5C regulation pattern is identified as the key to gemcitabine resistance in pancreatic cancer.Front Oncol. 2022 Jul 25;12:903484. doi: 10.3389/fonc.2022.903484. eCollection 2022. Front Oncol. 2022. PMID: 35957917 Free PMC article.
-
MicroRNA Signature in Melanoma: Biomarkers and Therapeutic Targets.Front Oncol. 2021 Apr 22;11:608987. doi: 10.3389/fonc.2021.608987. eCollection 2021. Front Oncol. 2021. PMID: 33968718 Free PMC article. Review.
-
Tumor Suppressor Properties of Small C-Terminal Domain Phosphatases in Clear Cell Renal Cell Carcinoma.Int J Mol Sci. 2023 Aug 19;24(16):12986. doi: 10.3390/ijms241612986. Int J Mol Sci. 2023. PMID: 37629167 Free PMC article.
-
MicroRNA-18a prevents senescence of mesenchymal stem cells by targeting CTDSPL.Aging (Albany NY). 2024 Mar 7;16(5):4904-4919. doi: 10.18632/aging.205642. Epub 2024 Mar 7. Aging (Albany NY). 2024. PMID: 38460957 Free PMC article.
-
A Review of MicroRNA in Uveal Melanoma.Onco Targets Ther. 2020 Jul 1;13:6351-6359. doi: 10.2147/OTT.S253946. eCollection 2020. Onco Targets Ther. 2020. PMID: 32669855 Free PMC article. Review.
References
MeSH terms
Substances
Grants and funding
- 201402014/the Scientific Research Program of National Health and Family Planning Commission of China
- 81402258/the National Natural Science Foundation of China grant
- 81570884/the National Natural Science Foundation of China grant
- 81602366/the National Natural Science Foundation of China grant
- 14SG18/the ShuGuang Project of Shanghai Municipal Education Commission and Shanghai Education Development Foundation
LinkOut - more resources
Full Text Sources
Other Literature Sources
Medical
Molecular Biology Databases
