

Trypanosoma cruzi activates mouse cardiac fibroblasts in vitro leading to fibroblast-myofibroblast transition and increase in expression of extracellular matrix proteins
- PMID: 29382361
- PMCID: PMC5791182
- DOI: 10.1186/s13071-018-2614-1
Trypanosoma cruzi activates mouse cardiac fibroblasts in vitro leading to fibroblast-myofibroblast transition and increase in expression of extracellular matrix proteins
Abstract
Background: Cardiac fibrosis is a consequence of chronic chagasic cardiomyopathy (CCC). In other cardiovascular diseases, the protagonist role of fibroblasts in cardiac fibrosis is well established. However, the role of cardiac fibroblasts (CFs) in fibrosis during the CCC is not clear. Here, our aim was to investigate the effect of Trypanosoma cruzi, the etiological agent of Chagas disease on CFs activation.
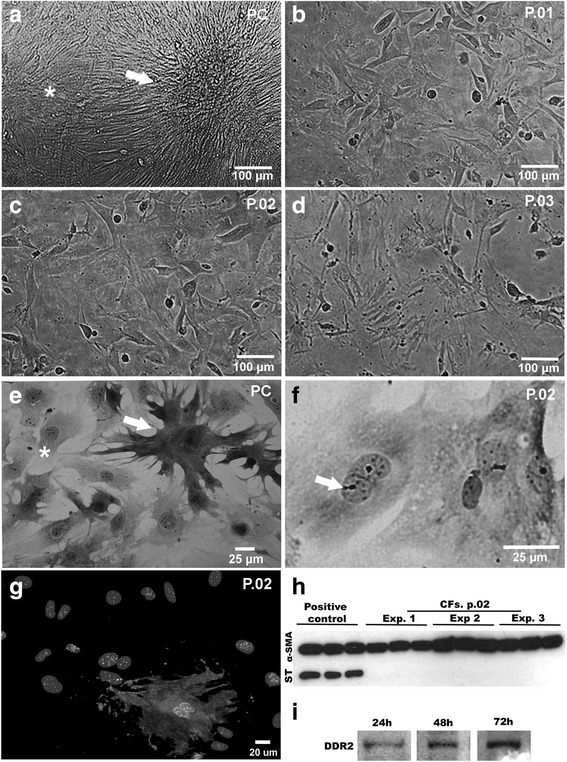
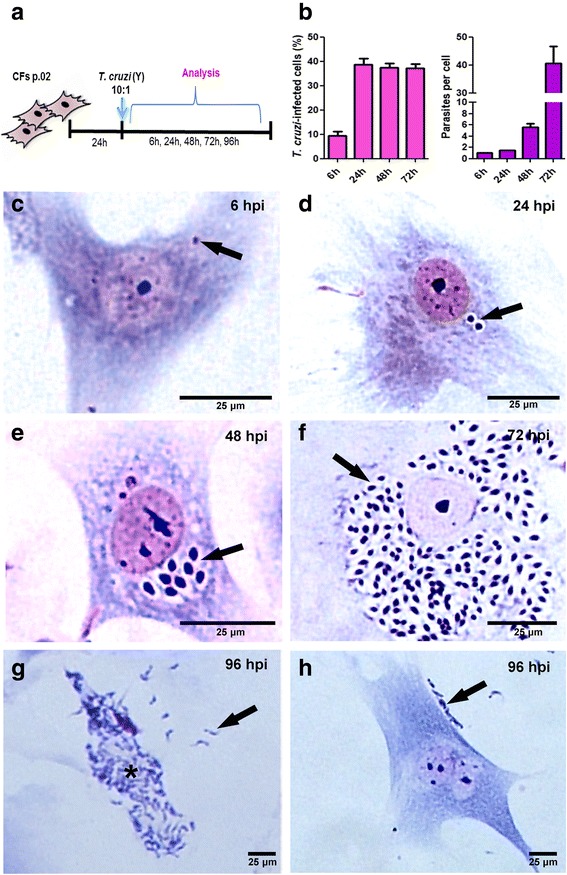
Methods: Cardiac fibroblasts were purified from primary cultures of mouse embryo cardiac cells. After two passages, cells were infected with T. cruzi (Y strain) and analyzed at different times for determination of infectivity, activation and production of extracellular matrix components (fibronectin, laminin and collagen IV) by immunofluorescence and western blot.
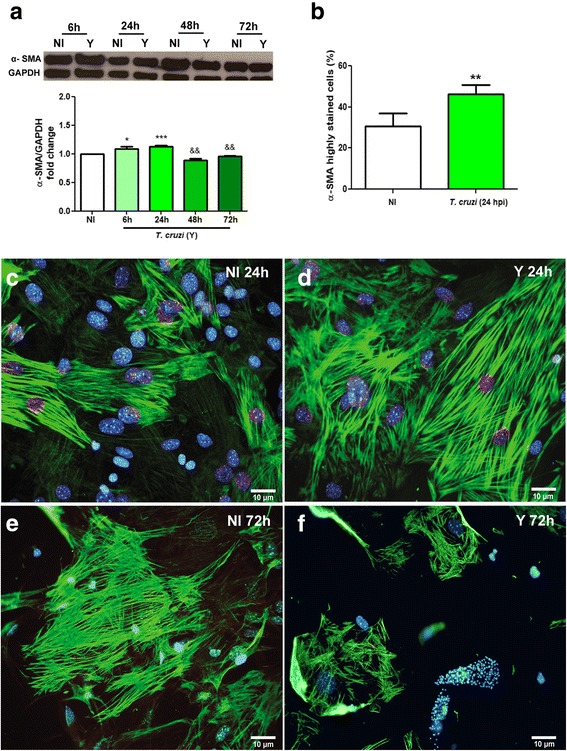
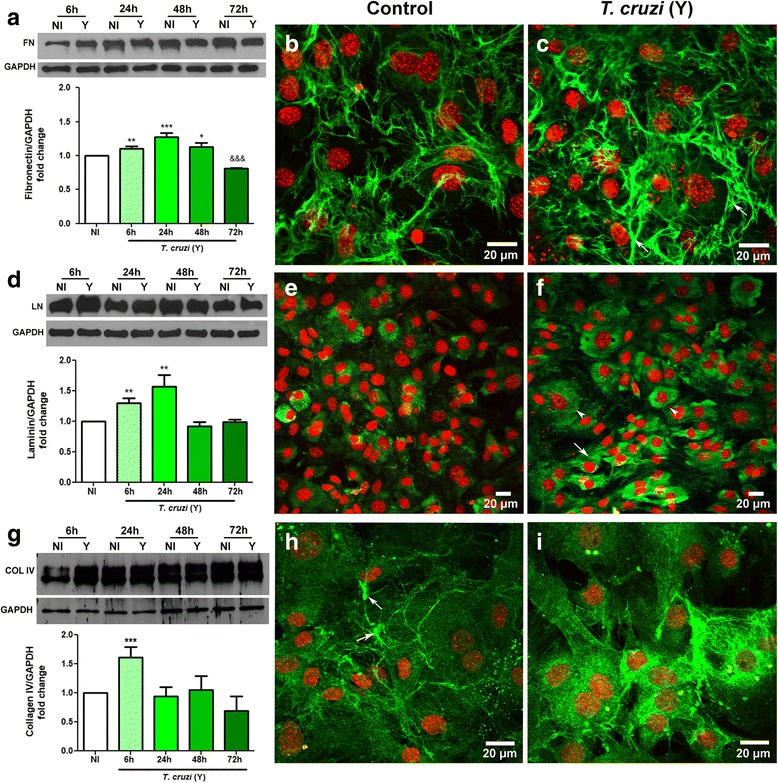
Results: At second passage, cultures were enriched in CFs (95% of fibroblasts and 5% of cardiomyocytes), as revealed by presence of alpha-smooth muscle actin (α-SMA) and discoidin domain receptor 2 (DDR2) and absence of sarcomeric tropomyosin (ST) protein expression. Trypanosoma cruzi infection induced fibroblast-myofibroblast transition, with increased expression of α-SMA after 6 and 24 h post-infection (hpi). Fibronectin was increased at 6, 24 and 48 hpi, laminin was increased at 6 and 24 hpi and collagen IV was increased at 6 hpi.
Conclusions: Our results showed that T. cruzi activates CFs, inducing activation and exacerbates ECM production. Furthermore, our data raise the possibility of the involvement of CFs in heart fibrosis during Chagas disease.
Keywords: Cardiac fibroblasts; Chagas disease; Extracellular matrix; Fibrosis; Trypanosoma cruzi.
Conflict of interest statement
Ethics approval and consent to participate
All procedures were approved by the Oswaldo Cruz Foundation Animal Welfare Committee (License number: LW-40/13) and were consistent with the USA National Institute of Health Guide for the Care and Use of Laboratory Animals (NIH Publication No. 85–23, revised 1996).
Consent for publication
Not applicable.
Competing interests
The authors declare that they have no competing interests.
Publisher’s Note
Springer Nature remains neutral with regard to jurisdictional claims in published maps and institutional affiliations.
Figures
Similar articles
-
Effect of Posaconazole in an in vitro model of cardiac fibrosis induced by Trypanosoma cruzi.Mol Biochem Parasitol. 2020 Jul;238:111283. doi: 10.1016/j.molbiopara.2020.111283. Epub 2020 Jun 18. Mol Biochem Parasitol. 2020. PMID: 32564978
-
Trypanosoma cruzi Induces the PARP1/AP-1 Pathway for Upregulation of Metalloproteinases and Transforming Growth Factor β in Macrophages: Role in Cardiac Fibroblast Differentiation and Fibrosis in Chagas Disease.mBio. 2020 Nov 10;11(6):e01853-20. doi: 10.1128/mBio.01853-20. mBio. 2020. PMID: 33172999 Free PMC article.
-
Fibrosis and hypertrophy induced by Trypanosoma cruzi in a three-dimensional cardiomyocyte-culture system.J Infect Dis. 2008 Mar 15;197(6):906-15. doi: 10.1086/528373. J Infect Dis. 2008. PMID: 18279074
-
Pivotal role for TGF-beta in infectious heart disease: The case of Trypanosoma cruzi infection and consequent Chagasic myocardiopathy.Cytokine Growth Factor Rev. 2008 Oct-Dec;19(5-6):405-13. doi: 10.1016/j.cytogfr.2008.08.002. Epub 2008 Oct 19. Cytokine Growth Factor Rev. 2008. PMID: 18938102 Review.
-
Mechanosensing dysregulation in the fibroblast: A hallmark of the aging heart.Ageing Res Rev. 2020 Nov;63:101150. doi: 10.1016/j.arr.2020.101150. Epub 2020 Aug 23. Ageing Res Rev. 2020. PMID: 32846223 Free PMC article. Review.
Cited by
-
Comparative microRNA profiling of Trypanosoma cruzi infected human cells.Front Cell Infect Microbiol. 2023 Jun 21;13:1187375. doi: 10.3389/fcimb.2023.1187375. eCollection 2023. Front Cell Infect Microbiol. 2023. PMID: 37424776 Free PMC article.
-
Platelet polyphosphate induces fibroblast chemotaxis and myofibroblast differentiation.J Thromb Haemost. 2020 Nov;18(11):3043-3052. doi: 10.1111/jth.15066. Epub 2020 Sep 10. J Thromb Haemost. 2020. PMID: 32808449 Free PMC article.
-
Functions of exogenous FGF signals in regulation of fibroblast to myofibroblast differentiation and extracellular matrix protein expression.Open Biol. 2022 Sep;12(9):210356. doi: 10.1098/rsob.210356. Epub 2022 Sep 14. Open Biol. 2022. PMID: 36102060 Free PMC article. Review.
-
Trypanosoma cruzi Infection Induces Cellular Stress Response and Senescence-Like Phenotype in Murine Fibroblasts.Front Immunol. 2018 Jul 9;9:1569. doi: 10.3389/fimmu.2018.01569. eCollection 2018. Front Immunol. 2018. PMID: 30038622 Free PMC article.
-
Aspirin-triggered resolvin D1 reduces parasitic cardiac load by decreasing inflammation in a murine model of early chronic Chagas disease.PLoS Negl Trop Dis. 2021 Nov 16;15(11):e0009978. doi: 10.1371/journal.pntd.0009978. eCollection 2021 Nov. PLoS Negl Trop Dis. 2021. PMID: 34784372 Free PMC article.
References
-
- WHO: Chagas’ disease (American trypanosomiasis). Fact sheet No. 340. http://www.who.int/mediacentre/factsheets/fs340/en/ (2016). Accessed 12 Dec 2017.
-
- DNDi. Doença de Chagas. http://www.dndial.org/pt/doencas-negligenciadas/doenca-de-chagas.html (2013). Accessed 12 Dec 2017.
Publication types
MeSH terms
Substances
LinkOut - more resources
Full Text Sources
Other Literature Sources
