. 2018 Jan 30;20(1):8.
doi: 10.1186/s13058-018-0933-y.

HER2 is not a cancer subtype but rather a pan-cancer event and is highly enriched in AR-driven breast tumors

Affiliations

HER2 is not a cancer subtype but rather a pan-cancer event and is highly enriched in AR-driven breast tumors

Anneleen Daemen et al. Breast Cancer Res. .

Abstract

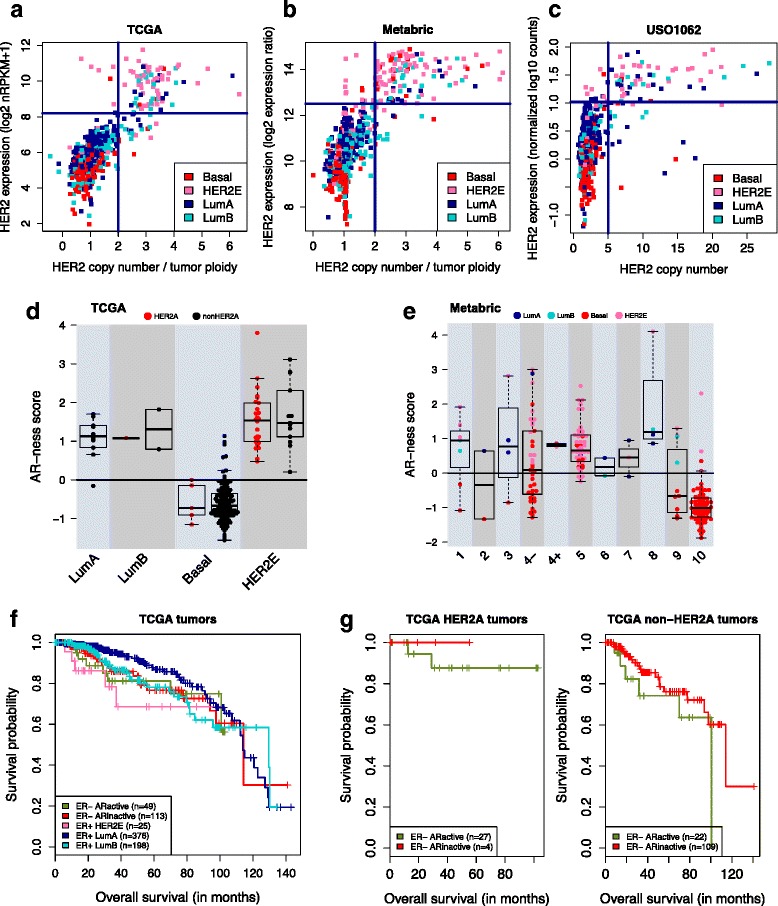
Background: Approximately one in five breast cancers are driven by amplification and overexpression of the human epidermal growth factor receptor 2 (HER2) receptor kinase, and HER2-enriched (HER2E) is one of four major transcriptional subtypes of breast cancer. We set out to understand the genomics of HER2 amplification independent of subtype, and the underlying drivers and biology of HER2E tumors.

Methods: We investigated published genomic data from 3155 breast tumors and 5391 non-breast tumors.

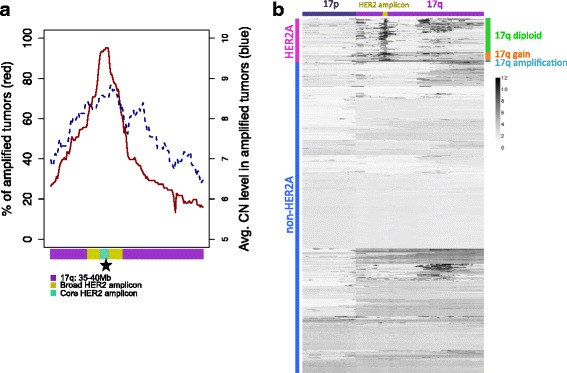
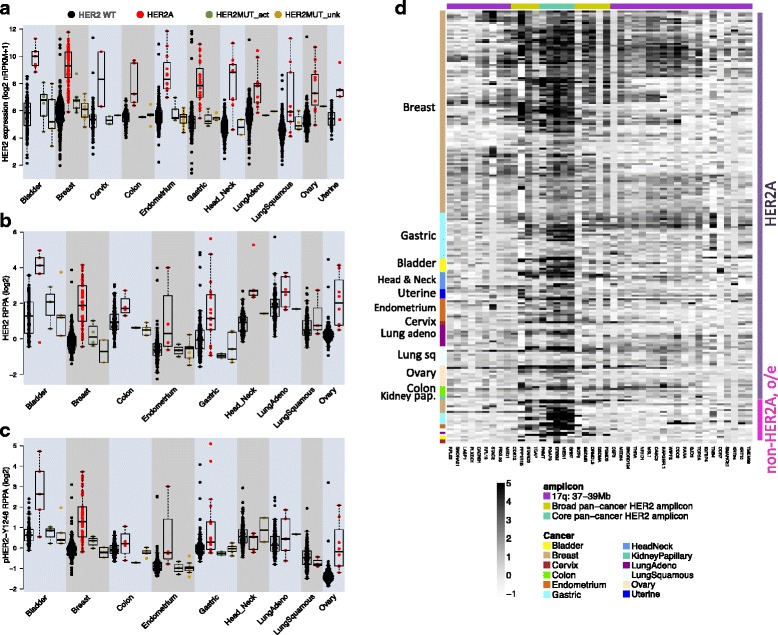
Results: HER2 amplification is a distinct driver event seen in all breast cancer subtypes, rather than a subtype marker, with major characteristics restricted to amplification and overexpression of HER2 and neighboring genes. The HER2E subtype has a distinctive transcriptional landscape independent of HER2A that reflects androgen receptor signaling as replacement for estrogen receptor (ER)-driven tumorigenesis. HER2 amplification is also an event in 1.8% of non-breast tumors.

Conclusions: These discoveries reveal therapeutic opportunities for combining anti-HER2 therapy with anti-androgen agents in breast cancer, and highlight the potential for broader therapeutic use of HER2 inhibitors.

Keywords: Amplification; Breast cancer; Cancer; ERBB2; Genomic characterization; HER2-targeted treatment; Molecular apocrine; PAM50.


Conflict of interest statement

Ethics approval and consent to participate

This study makes use of data generated by TCGA Research Network (http://cancergenome.nih.gov/) and the Molecular Taxonomy of Breast Cancer International Consortium (Metabric). Funding for the Metabric project was provided by Cancer Research UK and the British Columbia Cancer Agency Branch.

Consent for publication

Not applicable.

Competing interests

All authors are employees of Genentech and hold shares in Roche.

Publisher’s Note

Springer Nature remains neutral with regard to jurisdictional claims in published maps and institutional affiliations.

Figures

Fig. 1
Fig. 1
Human epidermal growth factor-2 (HER2) amplification in breast cancer is an event on top of a luminal (Lum), basal or androgen receptor (AR)-driven state. a, b HER2 expression versus the number of ploidy-corrected HER2 copies. Tumors are colored by prediction analysis of microarray 50 (PAM50) subtype. a Among The Cancer Genome Atlas (TCGA) breast tumors, 12.3% (n = 106) are HER2 amplified (HER2A), of which 83 have high HER2 expression (defined as log2(nRPKM + 1) ≥8.2 as per Additional file 3A). nRPKM reads per kilobase of exon model per million mapped reads normalized by size factor. b Among Metabric tumors, 12% (133/1107) are HER2A, of which 120 overexpress HER2 (defined as log2 expression ratio ≥12.5 as per Additional file 3E). c For the USO1062 trial with unavailable tumor ploidy, HER2A was defined as ≥5 copies of HER: 8% (79/987) of USO1062 tumors are HER2A, of which 58 overexpress HER2 (defined as normalized log10 counts ≥1.02 as per Additional file 3G). d AR-ness score across PAM50 subtypes for 178 breast tumors from TCGA that are estrogen receptor (ER)- by immunohistochemical staining (IHC). AR-ness score is calculated as the difference in average z-scored expression of 14 positive signature genes and average z-scored expression of 31 negative signature genes. Tumors are colored by HER2A status. e AR-ness score across the integrated clusters (IntClusts) for 202 breast tumors from Metabric that are ER- by IHC. Tumors are colored by PAM50 subtype. IntClust4 is divided into IntClusts 4- and 4+ by ER IHC, as per a previous publication [3]. f Kaplan-Meier curve of overall survival (OS) in 761 TCGA tumors with a median follow up of 27 months, divided into five groups based on ER IHC status, PAM50 subtype, and AR activity (positive versus negative AR-ness score). OS was truncated to 12 years of follow up. g Left, Kaplan-Meier curve of OS in 31 ER- HER2A tumors from TCGA, divided by AR-ness score. Right, Kaplan-Meier curve of OS in 131 ER- non-HER2A tumors from TCGA, divided by AR-ness score. OS was truncated to 12 years of follow up. HER2E HER2-enriched
Fig. 2
Fig. 2
Characterization of the human epidermal growth factor receptor 2 (HER2) amplicon and HER2 co-amplification in breast cancer. a Percentage of 106 HER2 amplified (HER2A) tumors from The Cancer Genome Atlas (TCGA) with gene amplification (solid red line, left axis), and average copy number (CN) level in HER2A tumors with gene amplification (indicated in dashed blue line, right axis), for genes on chromosome 17 from 35 Mb to 40 Mb (ordered by genomic location). Shown at the bottom are core HER2 amplicon (10) and broad HER2 amplicon (37) genes. The HER2 locus is starred. b Copy number of genes on chromosome 17 is shown for HER2A (top) and non-HER2A (bottom) TCGA tumors. Three distinct groups of HER2A tumors are labeled on the right: tumors with 17q arm-level amplification, defined as 5 or more copies for at least 80% of genes (cyan); tumors with 17q gain (copy number between 2.5 and 5 for 80% or more genes) (orange); and tumors that are mainly 17q diploid with copy number <2.5 for the majority of 17q genes (green). Chromosome 17 annotation is indicated on top. Regions 34.4–34.6 Mb and 44.1–44.8 Mb with germline micro-deletions or micro-gains were removed for visual purposes (see Additional file 9F-G)
Fig. 3
Fig. 3
The nature and role of human epidermal growth factor receptor 2 (HER2) amplified (HER2A) in other cancers. ac Tumors are grouped by HER2 amplification and mutation status. Tumors without HER2 amplification or mutation are shown in black, HER2A tumors (regardless of HER2 mutation) in red, unamplified tumors with an activating HER2 mutation (HER2MUT act) in green, and unamplified tumors with an untested or functionally inactive HER2 mutation (HER2MUT unk) in gold. a HER2 expression is consistently higher in HER2A tumors than in tumors without HER2 alteration, across all cancers (linear model with HER2 status and cancer, p = 0). Non-HER2A tumors with an activating or non-functional HER2 mutation have similar HER2 expression levels to unaltered tumors. b HER2 protein levels are higher in HER2A compared to unaltered tumors (p = 1e-104), though insignificant in lung squamous cell carcinoma (p = 0.08). HER2 protein levels in tumors with activating or non-functional HER2 mutations are similar to unaltered tumors. c Phospho-HER2 (Tyr1248) levels are significantly higher in HER2A bladder (p = 8e-12), breast (p = 3e-53), gastric (p = 1e-10), ovarian (p = 8e-20), and endometrial (p = 1e-8) tumors compared to unaltered tumors. pHER2 levels in tumors with activating or non-functional HER2 mutations are similar to unaltered tumors. d Expression of genes in a 2-Mb region around HER2, in a panel of HER2A tumors (top) and non-HER2A tumors with HER2 overexpression (o/e) (bottom). Expression is normalized per cancer to the median expression of each gene in tumors with 2 or fewer HER2 copies. The 2.5% lowest and highest values are saturated for better contrast. Genes are colored by core and broad pan-cancer HER2 amplicon

References

    1. Parker JS, Mullins M, Cheang MCU, Leung S, Voduc D, Vickery T, et al. Supervised risk predictor of breast cancer based on intrinsic subtypes. J Clin Oncol Off J Am Soc Clin Oncol. 2009;27:1160–7. doi: 10.1200/JCO.2008.18.1370. - DOI - PMC - PubMed
    1. Curtis C, Shah SP, Chin S-F, Turashvili G, Rueda OM, Dunning MJ, et al. The genomic and transcriptomic architecture of 2,000 breast tumours reveals novel subgroups. Nature. 2012;486:346–52. - PMC - PubMed
    1. Pereira B, Chin S-F, Rueda OM, Vollan H-KM, Provenzano E, Bardwell HA, et al. The somatic mutation profiles of 2,433 breast cancers refines their genomic and transcriptomic landscapes. Nat Commun. 2016;7:11479. doi: 10.1038/ncomms11479. - DOI - PMC - PubMed
    1. Dawson S-J, Rueda OM, Aparicio S, Caldas C. A new genome-driven integrated classification of breast cancer and its implications. EMBO J. 2013;32:617–28. doi: 10.1038/emboj.2013.19. - DOI - PMC - PubMed
    1. Lehmann-Che J, Hamy A-S, Porcher R, Barritault M, Bouhidel F, Habuellelah H, et al. Molecular apocrine breast cancers are aggressive estrogen receptor negative tumors overexpressing either HER2 or GCDFP15. Breast Cancer Res. 2013;15:R37. doi: 10.1186/bcr3421. - DOI - PMC - PubMed

MeSH terms