

What is the impact on health and wellbeing of interventions that foster respect and social inclusion in community-residing older adults? A systematic review of quantitative and qualitative studies
- PMID: 29382375
- PMCID: PMC5789687
- DOI: 10.1186/s13643-018-0680-2
What is the impact on health and wellbeing of interventions that foster respect and social inclusion in community-residing older adults? A systematic review of quantitative and qualitative studies
Abstract
Background: Many interventions have been developed to promote respect and social inclusion among older people, but the evidence on their impacts on health has not been synthesised. This systematic review aims to appraise the state of the evidence across the quantitative and qualitative literature.
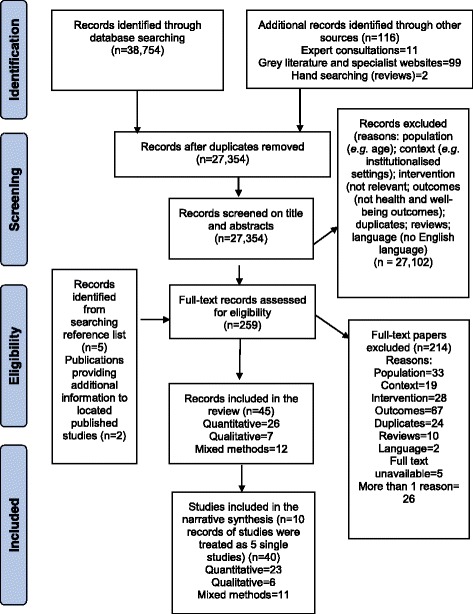
Methods: Eligible studies published between 1990 and 2015 were identified by scanning seven bibliographic databases using a pre-piloted strategy, searching grey literature and contacting experts. Studies were included if they assessed the impact (quantitatively) and/or perceived impact (qualitatively) of an intervention promoting respect and social inclusion on the physical or mental health of community-residing people aged 60 years and older. Titles and abstracts were screened for eligibility by one reviewer. A second reviewer independently screened a 10% random sample. Full texts were screened for eligibility by one reviewer, with verification by another reviewer. Risk of bias was assessed using standardised tools. Findings were summarised using narrative synthesis, harvest plots and logic models to depict the potential pathways to health outcomes.
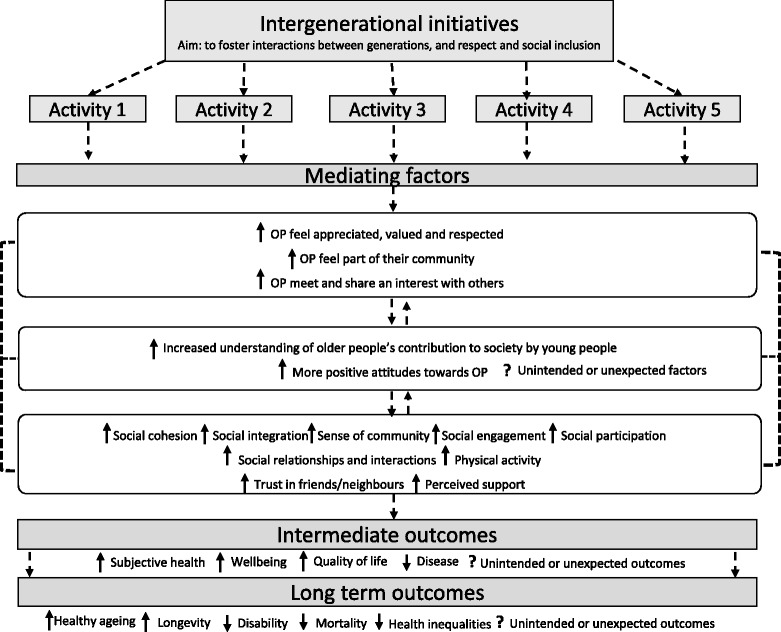
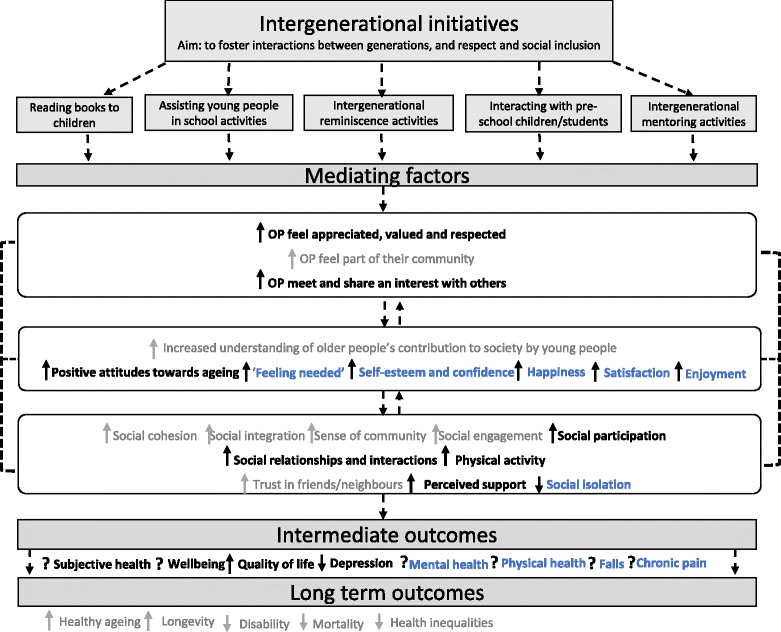
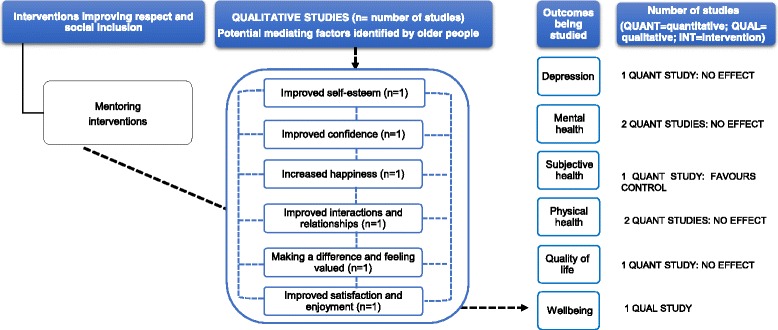
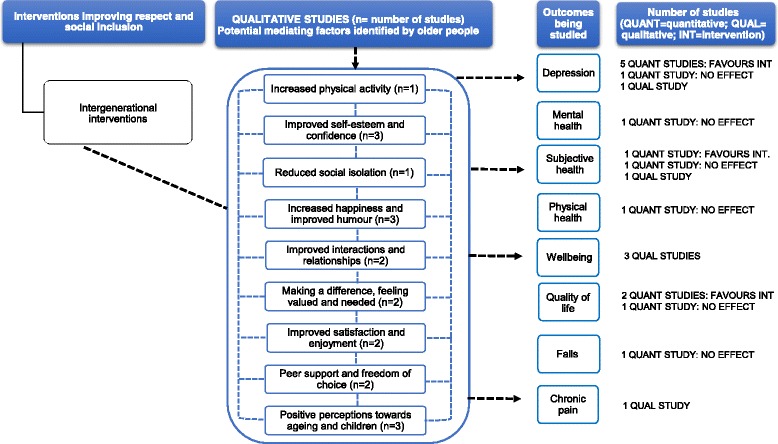
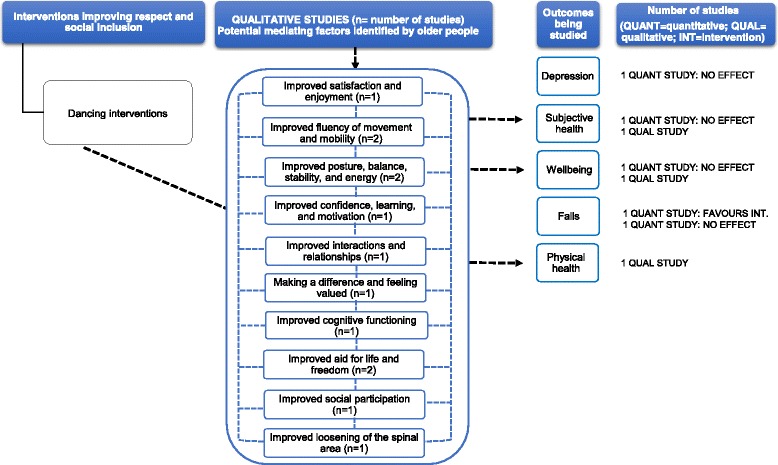
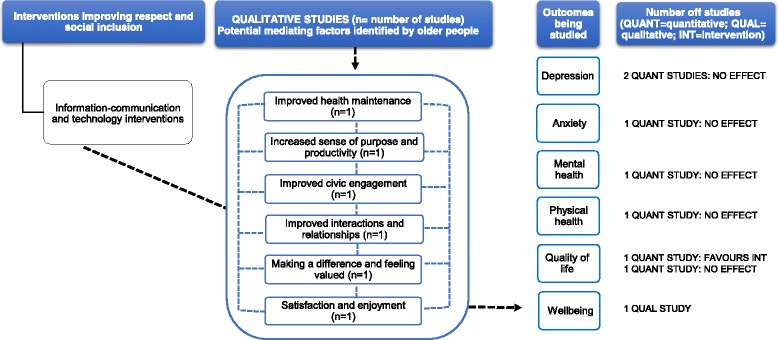
Results: Of the 27,354 records retrieved, 40 studies (23 quantitative, 6 qualitative, 11 mixed methods) were included. All studies were conducted in high and upper middle-income countries. Interventions involved mentoring, intergenerational and multi-activity programmes, dancing, music and singing, art and culture and information-communication technology. Most studies (n = 24) were at high or moderate risk of bias. Music and singing, intergenerational interventions, art and culture and multi-activity interventions were associated with an overall positive impact on health outcomes. This included depression (n = 3), wellbeing (n = 3), subjective health (n = 2), quality of life (n = 2), perceived stress and mental health (n = 2) and physical health (n = 2). Qualitative studies offered explanations for mediating factors (e.g. improved self-esteem) that may lead to improved health outcomes and contributed to the assessment of causation.
Conclusions: Whilst this review suggests that some interventions may positively impact on the health outcomes of older people, and identified mediating factors to health outcomes, the evidence is based on studies with heterogeneous methodologies. Many of the interventions were delivered as projects to selected groups, raising important questions about the feasibility of wider implementation and the potential for population-wide benefits.
Systematic review registration: PROSPERO registration number CRD42014010107.
Keywords: Age-friendly environments; Ageing; Health impact; Older people; Social inclusion; Systematic review.
Conflict of interest statement
Ethics approval and consent to participate
N/A—No primary data collected
Consent for publication
N/A—No primary data collected
Competing interests
The authors declare that they have no competing interests.
Publisher’s Note
Springer Nature remains neutral with regard to jurisdictional claims in published maps and institutional affiliations.
Figures


Similar articles
-
Exercise interventions and patient beliefs for people with hip, knee or hip and knee osteoarthritis: a mixed methods review.Cochrane Database Syst Rev. 2018 Apr 17;4(4):CD010842. doi: 10.1002/14651858.CD010842.pub2. Cochrane Database Syst Rev. 2018. PMID: 29664187 Free PMC article.
-
Interventions for promoting habitual exercise in people living with and beyond cancer.Cochrane Database Syst Rev. 2018 Sep 19;9(9):CD010192. doi: 10.1002/14651858.CD010192.pub3. Cochrane Database Syst Rev. 2018. PMID: 30229557 Free PMC article.
-
Music interventions for improving psychological and physical outcomes in people with cancer.Cochrane Database Syst Rev. 2021 Oct 12;10(10):CD006911. doi: 10.1002/14651858.CD006911.pub4. Cochrane Database Syst Rev. 2021. PMID: 34637527 Free PMC article.
-
Interventions for interpersonal communication about end of life care between health practitioners and affected people.Cochrane Database Syst Rev. 2022 Jul 8;7(7):CD013116. doi: 10.1002/14651858.CD013116.pub2. Cochrane Database Syst Rev. 2022. PMID: 35802350 Free PMC article.
-
Signs and symptoms to determine if a patient presenting in primary care or hospital outpatient settings has COVID-19.Cochrane Database Syst Rev. 2022 May 20;5(5):CD013665. doi: 10.1002/14651858.CD013665.pub3. Cochrane Database Syst Rev. 2022. PMID: 35593186 Free PMC article.
Cited by
-
Behaviour change interventions to promote health and well-being among older migrants: A systematic review.PLoS One. 2022 Jun 16;17(6):e0269778. doi: 10.1371/journal.pone.0269778. eCollection 2022. PLoS One. 2022. PMID: 35709205 Free PMC article.
-
Designing a stakeholder-inclusive service model for an eHealth service to support older adults in an active and social life.BMC Health Serv Res. 2021 Jul 5;21(1):654. doi: 10.1186/s12913-021-06597-9. BMC Health Serv Res. 2021. PMID: 34225745 Free PMC article.
-
Social prescribing: where is the evidence?Br J Gen Pract. 2019 Jan;69(678):6-7. doi: 10.3399/bjgp19X700325. Br J Gen Pract. 2019. PMID: 30591594 Free PMC article. No abstract available.
-
Current state of the literature on mental health in Liberia: A systematic review.S Afr J Psychiatr. 2020 Oct 26;26:1502. doi: 10.4102/sajpsychiatry.v26i0.1502. eCollection 2020. S Afr J Psychiatr. 2020. PMID: 33240551 Free PMC article.
-
Late-life learning and health: challenges, opportunities, and future directions.Lancet Healthy Longev. 2021 Oct;2(10):e613-e614. doi: 10.1016/S2666-7568(21)00207-5. Lancet Healthy Longev. 2021. PMID: 34632440 Free PMC article. No abstract available.
References
-
- United Nations Department of Economic and Social Affairs Population Division. World population, ageing. New York; 2015. doi:ST/ESA/SER.A/390
-
- World Health Organization. Measuring the age-friendliness of cities: A guide to using core indicators. Geneva; 2016. http://www.who.int/kobe_centre/publications/AFC_guide/en/. Accessed 2 Oct 2017
-
- Rechel B, Grundy E, Robine J. Ageing in the European Union. Lancet. 2013;6736:1–11. - PubMed
-
- World Health Organization. The world report on ageing and health. Luxembourg; 2015. 10.1093/geront/gnw037.
Publication types
MeSH terms
LinkOut - more resources
Full Text Sources
Other Literature Sources
Medical
Molecular Biology Databases
