

Using DNase Hi-C techniques to map global and local three-dimensional genome architecture at high resolution
- PMID: 29382556
- PMCID: PMC5993575
- DOI: 10.1016/j.ymeth.2018.01.014
Using DNase Hi-C techniques to map global and local three-dimensional genome architecture at high resolution
Abstract
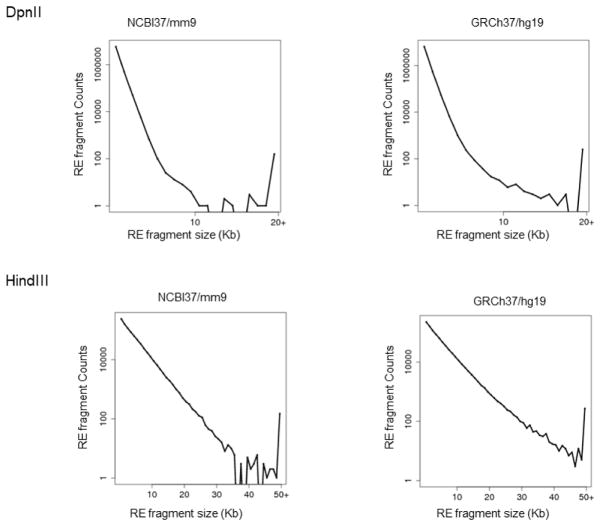
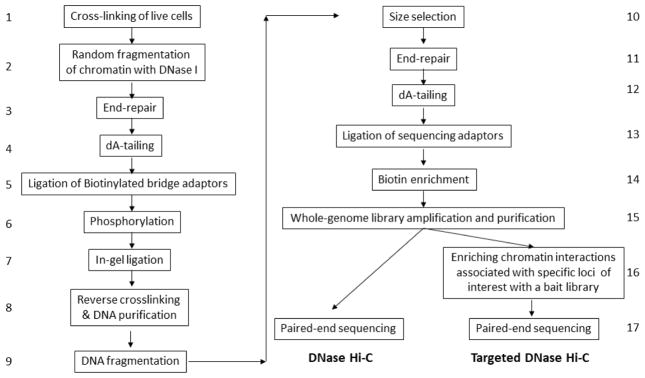
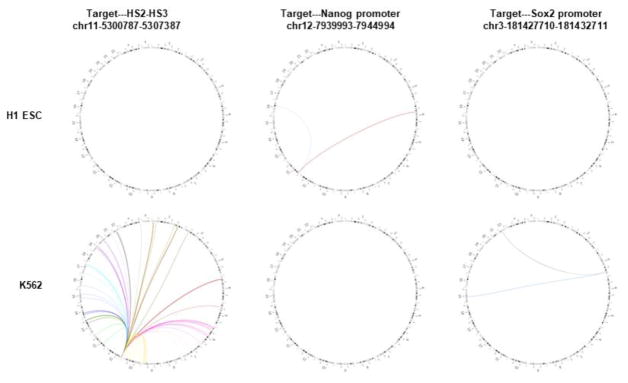
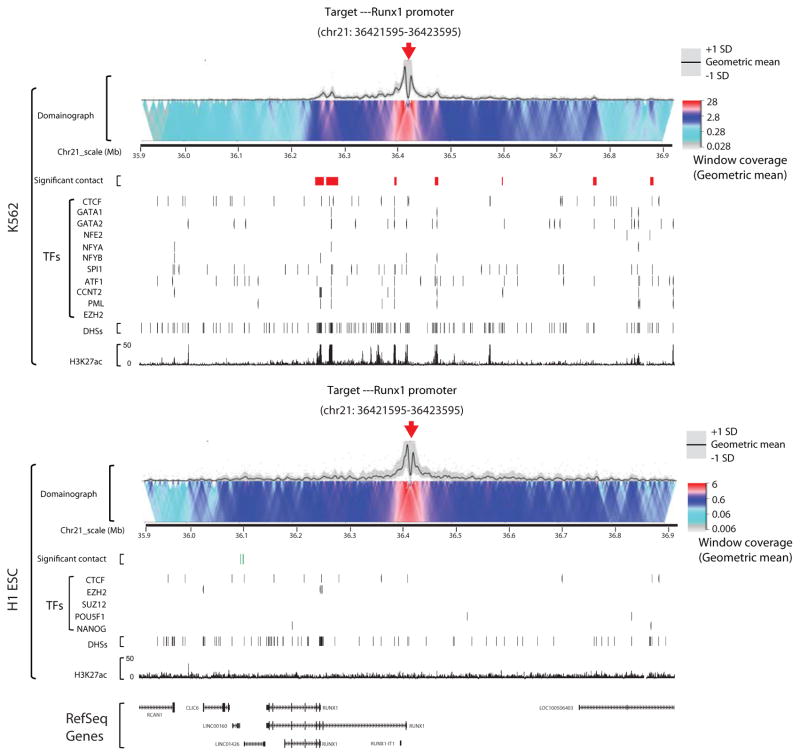
The folding and three-dimensional (3D) organization of chromatin in the nucleus critically impacts genome function. The past decade has witnessed rapid advances in genomic tools for delineating 3D genome architecture. Among them, chromosome conformation capture (3C)-based methods such as Hi-C are the most widely used techniques for mapping chromatin interactions. However, traditional Hi-C protocols rely on restriction enzymes (REs) to fragment chromatin and are therefore limited in resolution. We recently developed DNase Hi-C for mapping 3D genome organization, which uses DNase I for chromatin fragmentation. DNase Hi-C overcomes RE-related limitations associated with traditional Hi-C methods, leading to improved methodological resolution. Furthermore, combining this method with DNA capture technology provides a high-throughput approach (targeted DNase Hi-C) that allows for mapping fine-scale chromatin architecture at exceptionally high resolution. Hence, targeted DNase Hi-C will be valuable for delineating the physical landscapes of cis-regulatory networks that control gene expression and for characterizing phenotype-associated chromatin 3D signatures. Here, we provide a detailed description of method design and step-by-step working protocols for these two methods.
Keywords: Chromatin; Chromosome; Chromosome conformation capture (3C); DNase Hi-C; Hi-C; Three-dimensional (3D) genome architecture.
Copyright © 2018 Elsevier Inc. All rights reserved.
Figures
Similar articles
-
Targeted DNase Hi-C.Methods Mol Biol. 2021;2157:65-83. doi: 10.1007/978-1-0716-0664-3_5. Methods Mol Biol. 2021. PMID: 32820399 Free PMC article.
-
Iteratively improving Hi-C experiments one step at a time.Methods. 2018 Jun 1;142:47-58. doi: 10.1016/j.ymeth.2018.04.033. Epub 2018 Apr 30. Methods. 2018. PMID: 29723572
-
Fine-scale chromatin interaction maps reveal the cis-regulatory landscape of human lincRNA genes.Nat Methods. 2015 Jan;12(1):71-8. doi: 10.1038/nmeth.3205. Epub 2014 Dec 1. Nat Methods. 2015. PMID: 25437436 Free PMC article.
-
A genome-wide 3C-method for characterizing the three-dimensional architectures of genomes.Methods. 2012 Nov;58(3):277-88. doi: 10.1016/j.ymeth.2012.06.018. Epub 2012 Jul 6. Methods. 2012. PMID: 22776363 Free PMC article. Review.
-
A (3D-Nuclear) Space Odyssey: Making Sense of Hi-C Maps.Genes (Basel). 2019 May 29;10(6):415. doi: 10.3390/genes10060415. Genes (Basel). 2019. PMID: 31146487 Free PMC article. Review.
Cited by
-
Stress Conditions Modulate the Chromatin Interactions Network in Arabidopsis.Front Genet. 2022 Jan 5;12:799805. doi: 10.3389/fgene.2021.799805. eCollection 2021. Front Genet. 2022. PMID: 35069698 Free PMC article.
-
HIFI: estimating DNA-DNA interaction frequency from Hi-C data at restriction-fragment resolution.Genome Biol. 2020 Jan 14;21(1):11. doi: 10.1186/s13059-019-1913-y. Genome Biol. 2020. PMID: 31937349 Free PMC article.
-
Methods for mapping 3D chromosome architecture.Nat Rev Genet. 2020 Apr;21(4):207-226. doi: 10.1038/s41576-019-0195-2. Epub 2019 Dec 17. Nat Rev Genet. 2020. PMID: 31848476 Review.
-
dcHiC detects differential compartments across multiple Hi-C datasets.Nat Commun. 2022 Nov 11;13(1):6827. doi: 10.1038/s41467-022-34626-6. Nat Commun. 2022. PMID: 36369226 Free PMC article.
-
A chromosome-level reference genome assembly and a full-length transcriptome assembly of the giant freshwater prawn (Macrobrachium rosenbergii).G3 (Bethesda). 2024 Sep 4;14(9):jkae146. doi: 10.1093/g3journal/jkae146. G3 (Bethesda). 2024. PMID: 38973709 Free PMC article.
References
-
- Misteli T. Beyond the sequence: cellular organization of genome function. Cell. 2007;128(4):787–800. - PubMed
-
- Krijger PH, de Laat W. Regulation of disease-associated gene expression in the 3D genome. Nature reviews Molecular cell biology. 2016;17(12):771–782. - PubMed
-
- Bickmore WA. The spatial organization of the human genome. Annu Rev Genomics Hum Genet. 2013;14:67–84. - PubMed
Publication types
MeSH terms
Substances
Grants and funding
LinkOut - more resources
Full Text Sources
Other Literature Sources
Miscellaneous
