

Inhibiting Integrin α5 Cytoplasmic Domain Signaling Reduces Atherosclerosis and Promotes Arteriogenesis
- PMID: 29382667
- PMCID: PMC5850249
- DOI: 10.1161/JAHA.117.007501
Inhibiting Integrin α5 Cytoplasmic Domain Signaling Reduces Atherosclerosis and Promotes Arteriogenesis
Abstract
Background: Fibronectin in endothelial basement membranes promotes endothelial inflammatory activation and atherosclerosis but also promotes plaque stability and vascular remodeling. The fibronectin receptor α5 subunit is proinflammatory through binding to and activating phosphodiesterase 4D5, which inhibits anti-inflammatory cyclic adenosine monophosphate and protein kinase A. Replacing the α5 cytoplasmic domain with that of α2 resulted in smaller atherosclerotic plaques. Here, we further assessed plaque phenotype and compensatory vascular remodeling in this model.
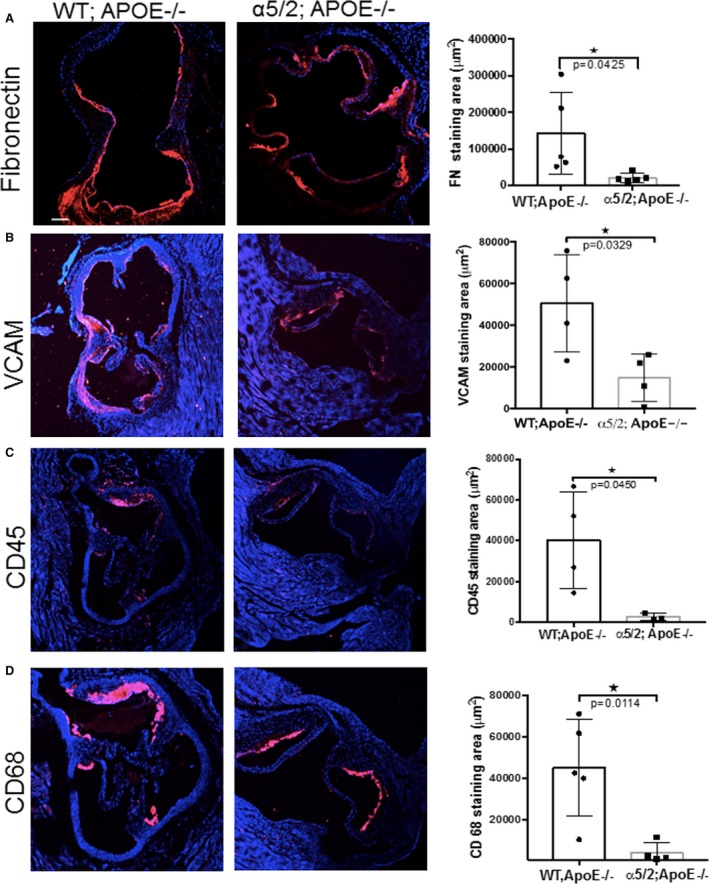
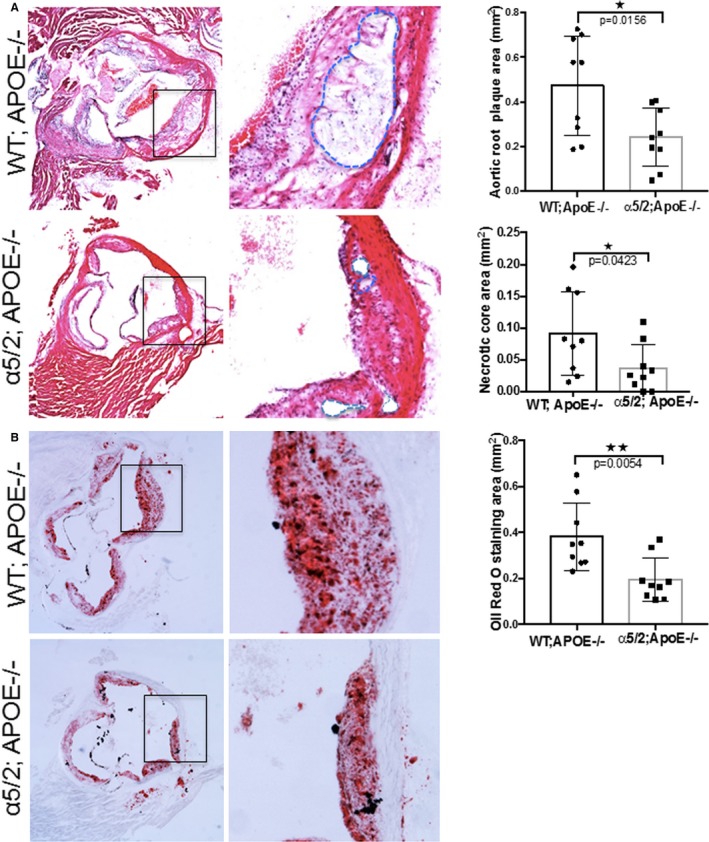
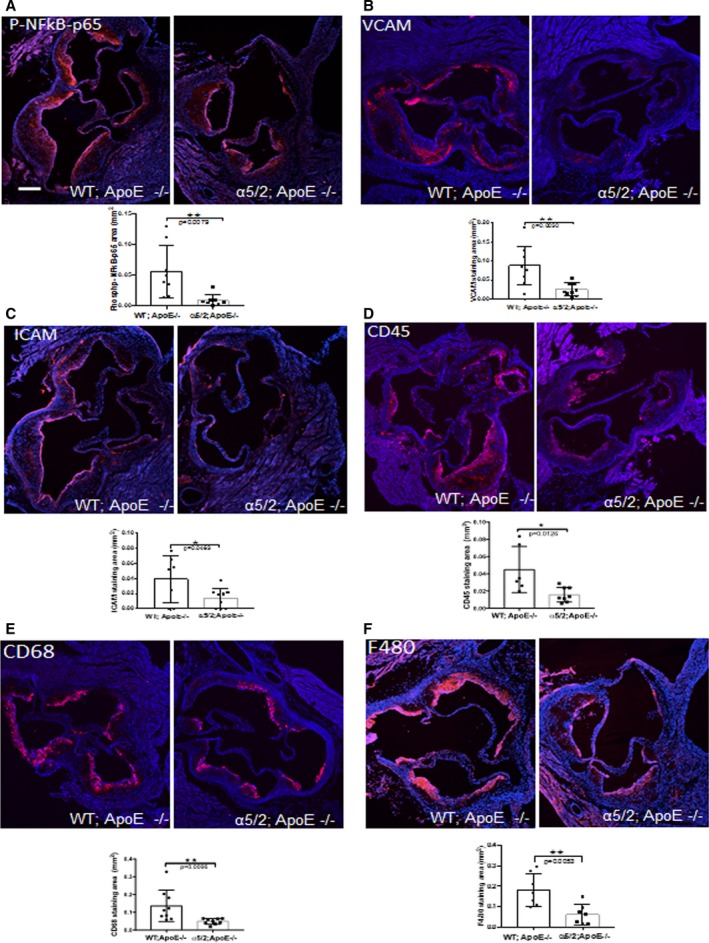
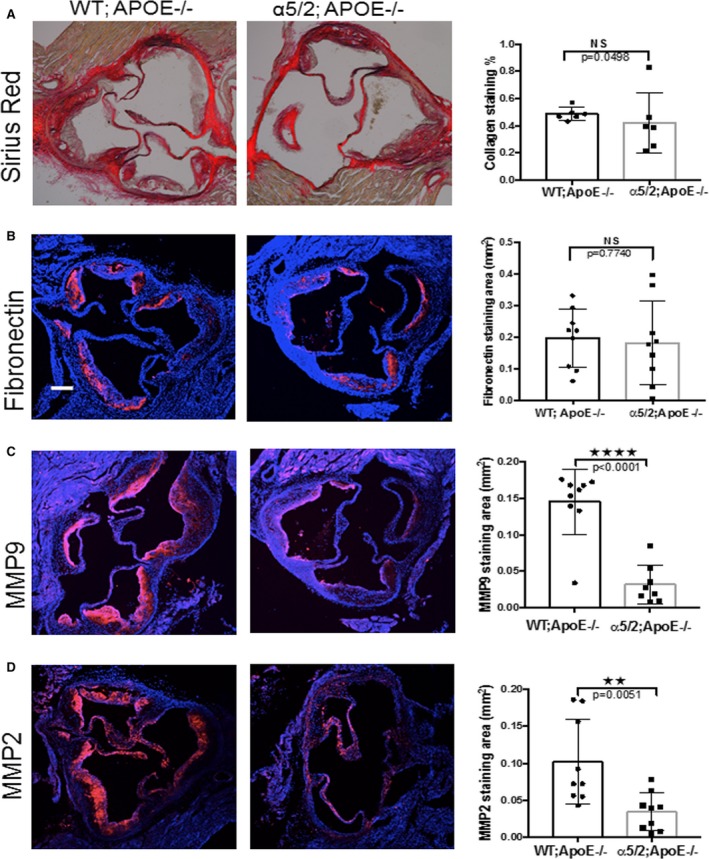
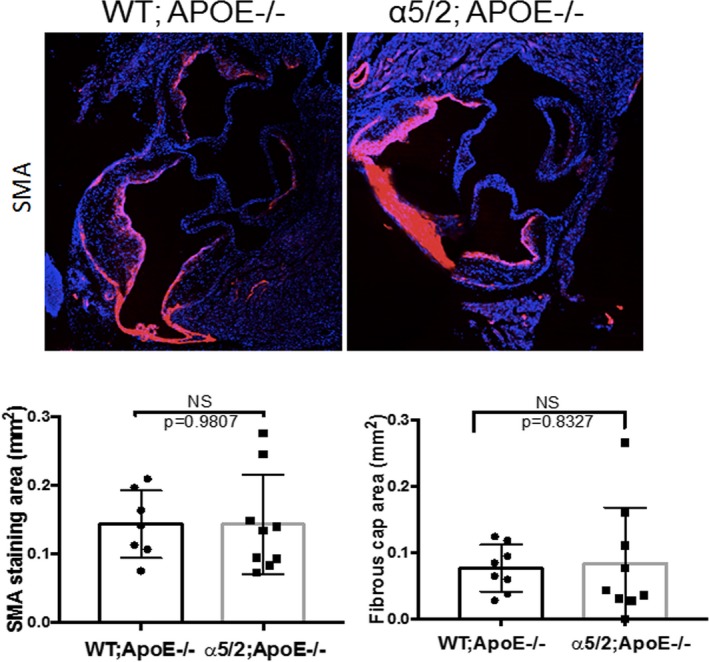
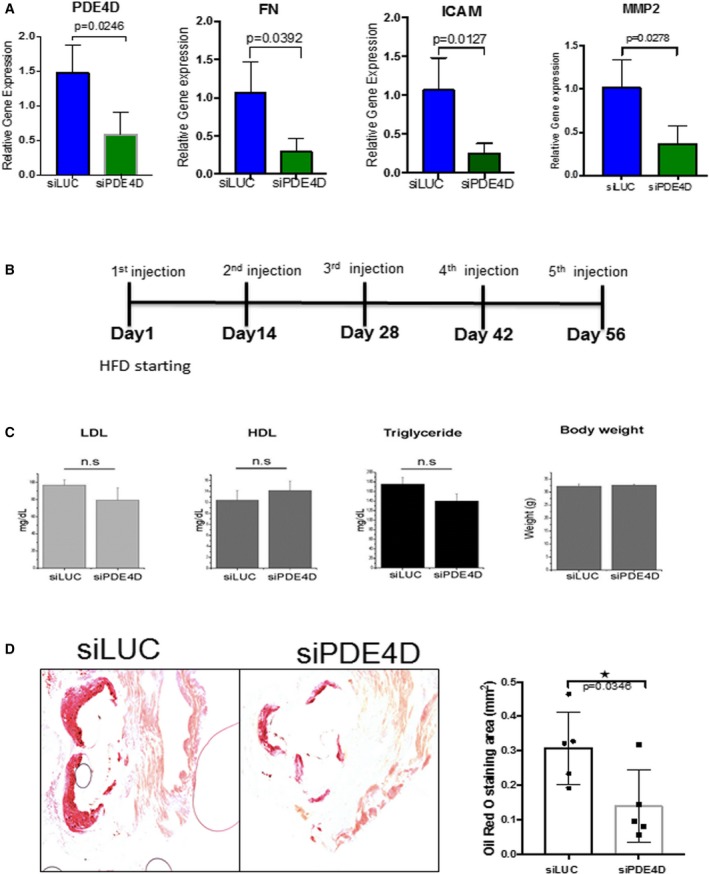
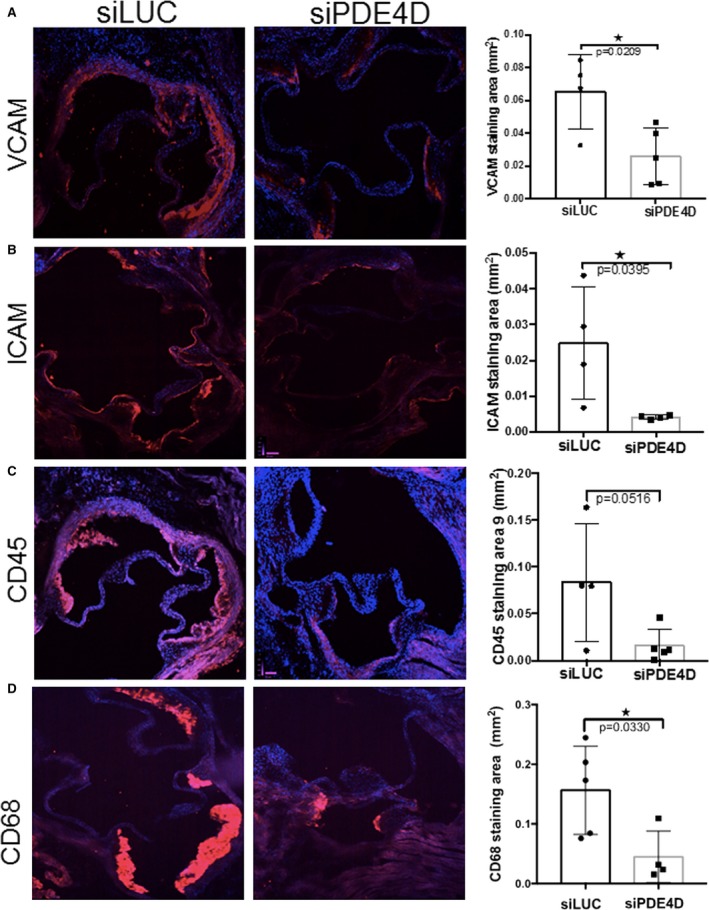
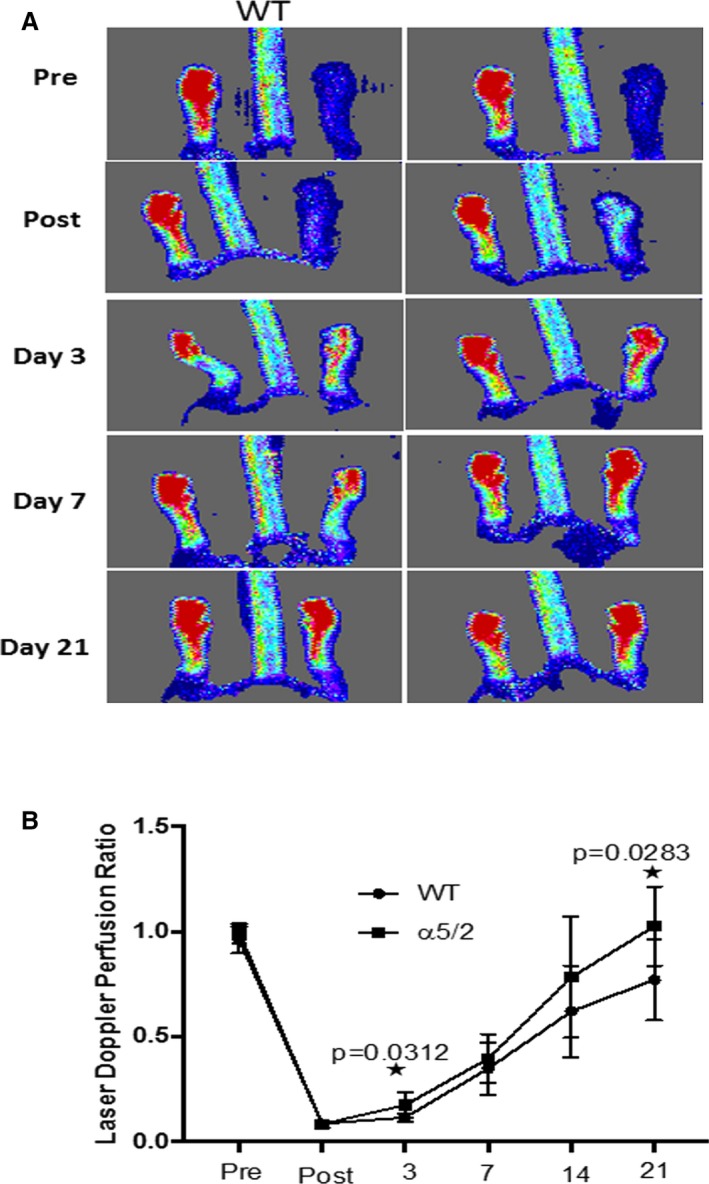
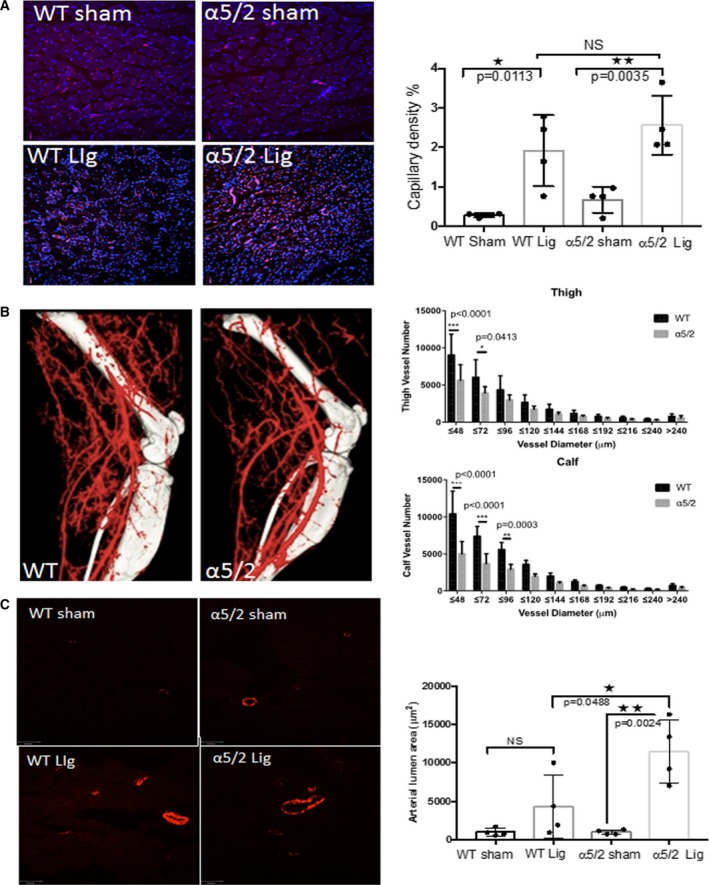
Methods and results: α5/2 mice in the hyperlipidemic apolipoprotein E null background had smaller plaques in the aortic root, with reduced endothelial NF-κB activation and inflammatory gene expression, reduced leukocyte content, and much lower metalloproteinase expression. However, smooth muscle cell content, fibrous cap thickness, and fibrillar collagen were unchanged, indicating no shift toward vulnerability. In vivo knockdown of phosphodiesterase 4D5 also decreased endothelial inflammatory activation and atherosclerotic plaque size. α5/2 mice showed improved recovery from hindlimb ischemia after femoral artery ligation.
Conclusions: Blocking the fibronectin-Integrin α5 pathway reduces atherosclerotic plaque size, maintains plaque stability, and improves compensatory remodeling. This pathway is therefore a potential therapeutic target for treatment of atherosclerosis.
Keywords: arteriogenesis; atherosclerosis; fibronectin; inflammation; matrix metalloprotease; phosphodiesterase 4D5; plaque vulnerability.
© 2018 The Authors. Published on behalf of the American Heart Association, Inc., by Wiley.
Figures
Similar articles
-
Endothelial Rap1 (Ras-Association Proximate 1) Restricts Inflammatory Signaling to Protect From the Progression of Atherosclerosis.Arterioscler Thromb Vasc Biol. 2021 Feb;41(2):638-650. doi: 10.1161/ATVBAHA.120.315401. Epub 2020 Dec 3. Arterioscler Thromb Vasc Biol. 2021. PMID: 33267664 Free PMC article.
-
Endothelial FN (Fibronectin) Deposition by α5β1 Integrins Drives Atherogenic Inflammation.Arterioscler Thromb Vasc Biol. 2018 Nov;38(11):2601-2614. doi: 10.1161/ATVBAHA.118.311705. Arterioscler Thromb Vasc Biol. 2018. PMID: 30354234 Free PMC article.
-
Endothelial Cell-Specific Deletion of P2Y2 Receptor Promotes Plaque Stability in Atherosclerosis-Susceptible ApoE-Null Mice.Arterioscler Thromb Vasc Biol. 2017 Jan;37(1):75-83. doi: 10.1161/ATVBAHA.116.308561. Epub 2016 Nov 17. Arterioscler Thromb Vasc Biol. 2017. PMID: 27856454 Free PMC article.
-
Mouse models of atherosclerosis and their suitability for the study of myocardial infarction.Basic Res Cardiol. 2020 Nov 30;115(6):73. doi: 10.1007/s00395-020-00829-5. Basic Res Cardiol. 2020. PMID: 33258000 Free PMC article. Review.
-
The Atherosclerotic Plaque Microenvironment as a Therapeutic Target.Curr Atheroscler Rep. 2025 Apr 2;27(1):47. doi: 10.1007/s11883-025-01294-y. Curr Atheroscler Rep. 2025. PMID: 40172727 Free PMC article. Review.
Cited by
-
Sex-Stratified Gene Regulatory Networks Reveal Female Key Driver Genes of Atherosclerosis Involved in Smooth Muscle Cell Phenotype Switching.Circulation. 2021 Feb 16;143(7):713-726. doi: 10.1161/CIRCULATIONAHA.120.051231. Epub 2021 Jan 27. Circulation. 2021. PMID: 33499648 Free PMC article.
-
Fibronectin-Mediated Inflammatory Signaling Through Integrin α5 in Vascular Remodeling.J Am Heart Assoc. 2021 Sep 7;10(17):e021160. doi: 10.1161/JAHA.121.021160. Epub 2021 Sep 2. J Am Heart Assoc. 2021. PMID: 34472370 Free PMC article.
-
Cathepsin K contributed to disturbed flow-induced atherosclerosis is dependent on integrin-actin cytoskeleton-NF-κB pathway.Genes Dis. 2022 Apr 25;10(2):583-595. doi: 10.1016/j.gendis.2022.03.020. eCollection 2023 Mar. Genes Dis. 2022. PMID: 37223522 Free PMC article.
-
Different Approaches in Therapy Aiming to Stabilize an Unstable Atherosclerotic Plaque.Int J Mol Sci. 2021 Apr 21;22(9):4354. doi: 10.3390/ijms22094354. Int J Mol Sci. 2021. PMID: 33919446 Free PMC article. Review.
-
Integrated Single-Cell Analysis Revealed Novel Subpopulations of Foamy Macrophages in Human Atherosclerotic Plaques.Biomolecules. 2024 Dec 16;14(12):1606. doi: 10.3390/biom14121606. Biomolecules. 2024. PMID: 39766313 Free PMC article.
References
-
- Herrington W, Lacey B, Sherliker P, Armitage J, Lewington S. Epidemiology of atherosclerosis and the potential to reduce the global burden of atherothrombotic disease. Circ Res. 2016;118:535–546. - PubMed
-
- Libby P, Ridker PM, Hansson GK. Progress and challenges in translating the biology of atherosclerosis. Nature. 2011;473:317–325. - PubMed
-
- Virmani R, Kolodgie FD, Burke AP, Farb A, Schwartz SM. Lessons from sudden coronary death: a comprehensive morphological classification scheme for atherosclerotic lesions. Arterioscler Thromb Vasc Biol. 2000;20:1262–1275. - PubMed
-
- Naghavi M, Libby P, Falk E, Casscells SW, Litovsky S, Rumberger J, Badimon JJ, Stefanadis C, Moreno P, Pasterkamp G, Fayad Z, Stone PH, Waxman S, Raggi P, Madjid M, Zarrabi A, Burke A, Yuan C, Fitzgerald PJ, Siscovick DS, de Korte CL, Aikawa M, Airaksinen KE, Assmann G, Becker CR, Chesebro JH, Farb A, Galis ZS, Jackson C, Jang IK, Koenig W, Lodder RA, March K, Demirovic J, Navab M, Priori SG, Rekhter MD, Bahr R, Grundy SM, Mehran R, Colombo A, Boerwinkle E, Ballantyne C, Insull W Jr, Schwartz RS, Vogel R, Serruys PW, Hansson GK, Faxon DP, Kaul S, Drexler H, Greenland P, Muller JE, Virmani R, Ridker PM, Zipes DP, Shah PK, Willerson JT. From vulnerable plaque to vulnerable patient: a call for new definitions and risk assessment strategies: Part II. Circulation. 2003;108:1772–1778. - PubMed
Publication types
MeSH terms
Substances
Grants and funding
LinkOut - more resources
Full Text Sources
Other Literature Sources
Medical
Molecular Biology Databases
Miscellaneous
