. 2018 Mar;6(3):332-347.
doi: 10.1158/2326-6066.CIR-17-0424. Epub 2018 Jan 30.

Mast Cell-Dependent CD8+ T-cell Recruitment Mediates Immune Surveillance of Intestinal Tumors in ApcMin/+ Mice

Affiliations

Mast Cell-Dependent CD8+ T-cell Recruitment Mediates Immune Surveillance of Intestinal Tumors in ApcMin/+ Mice

Sobha R Bodduluri et al. Cancer Immunol Res. 2018 Mar.

Abstract

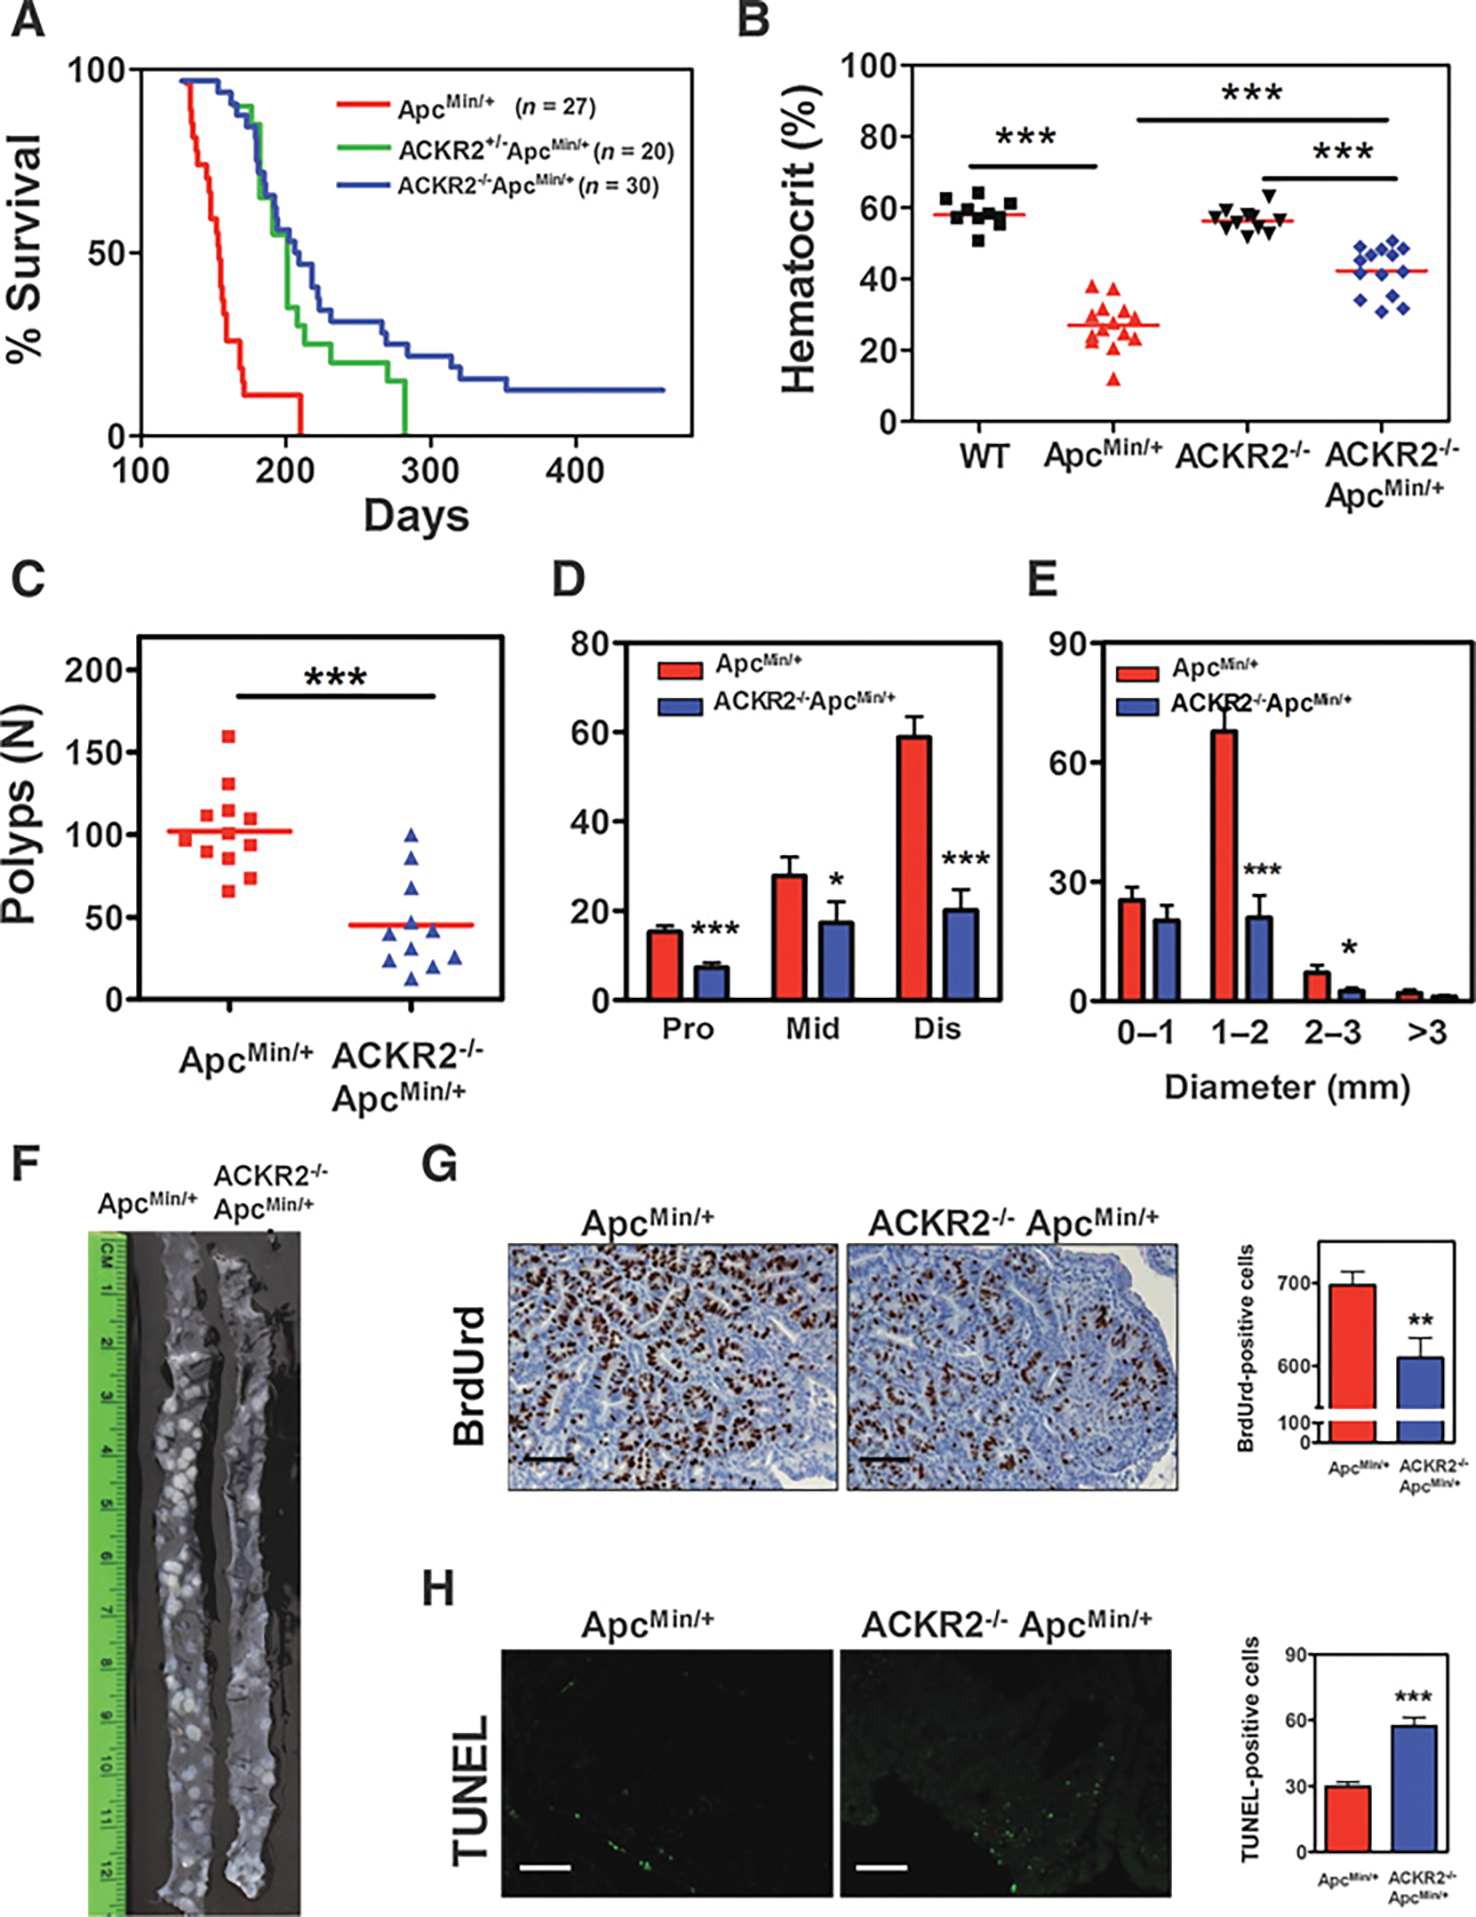
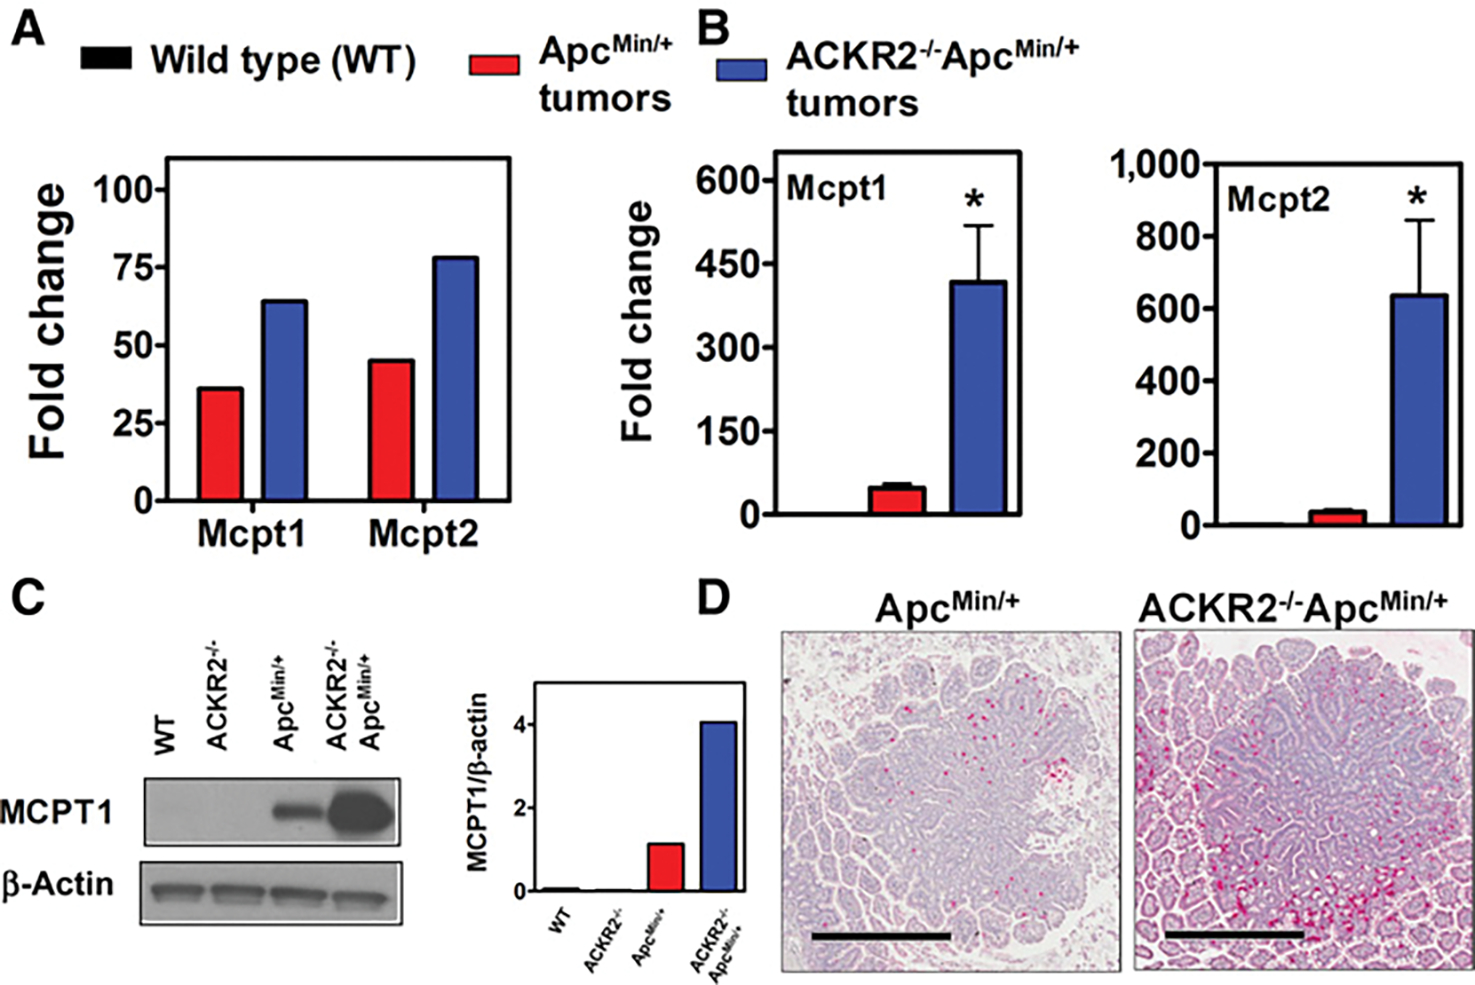
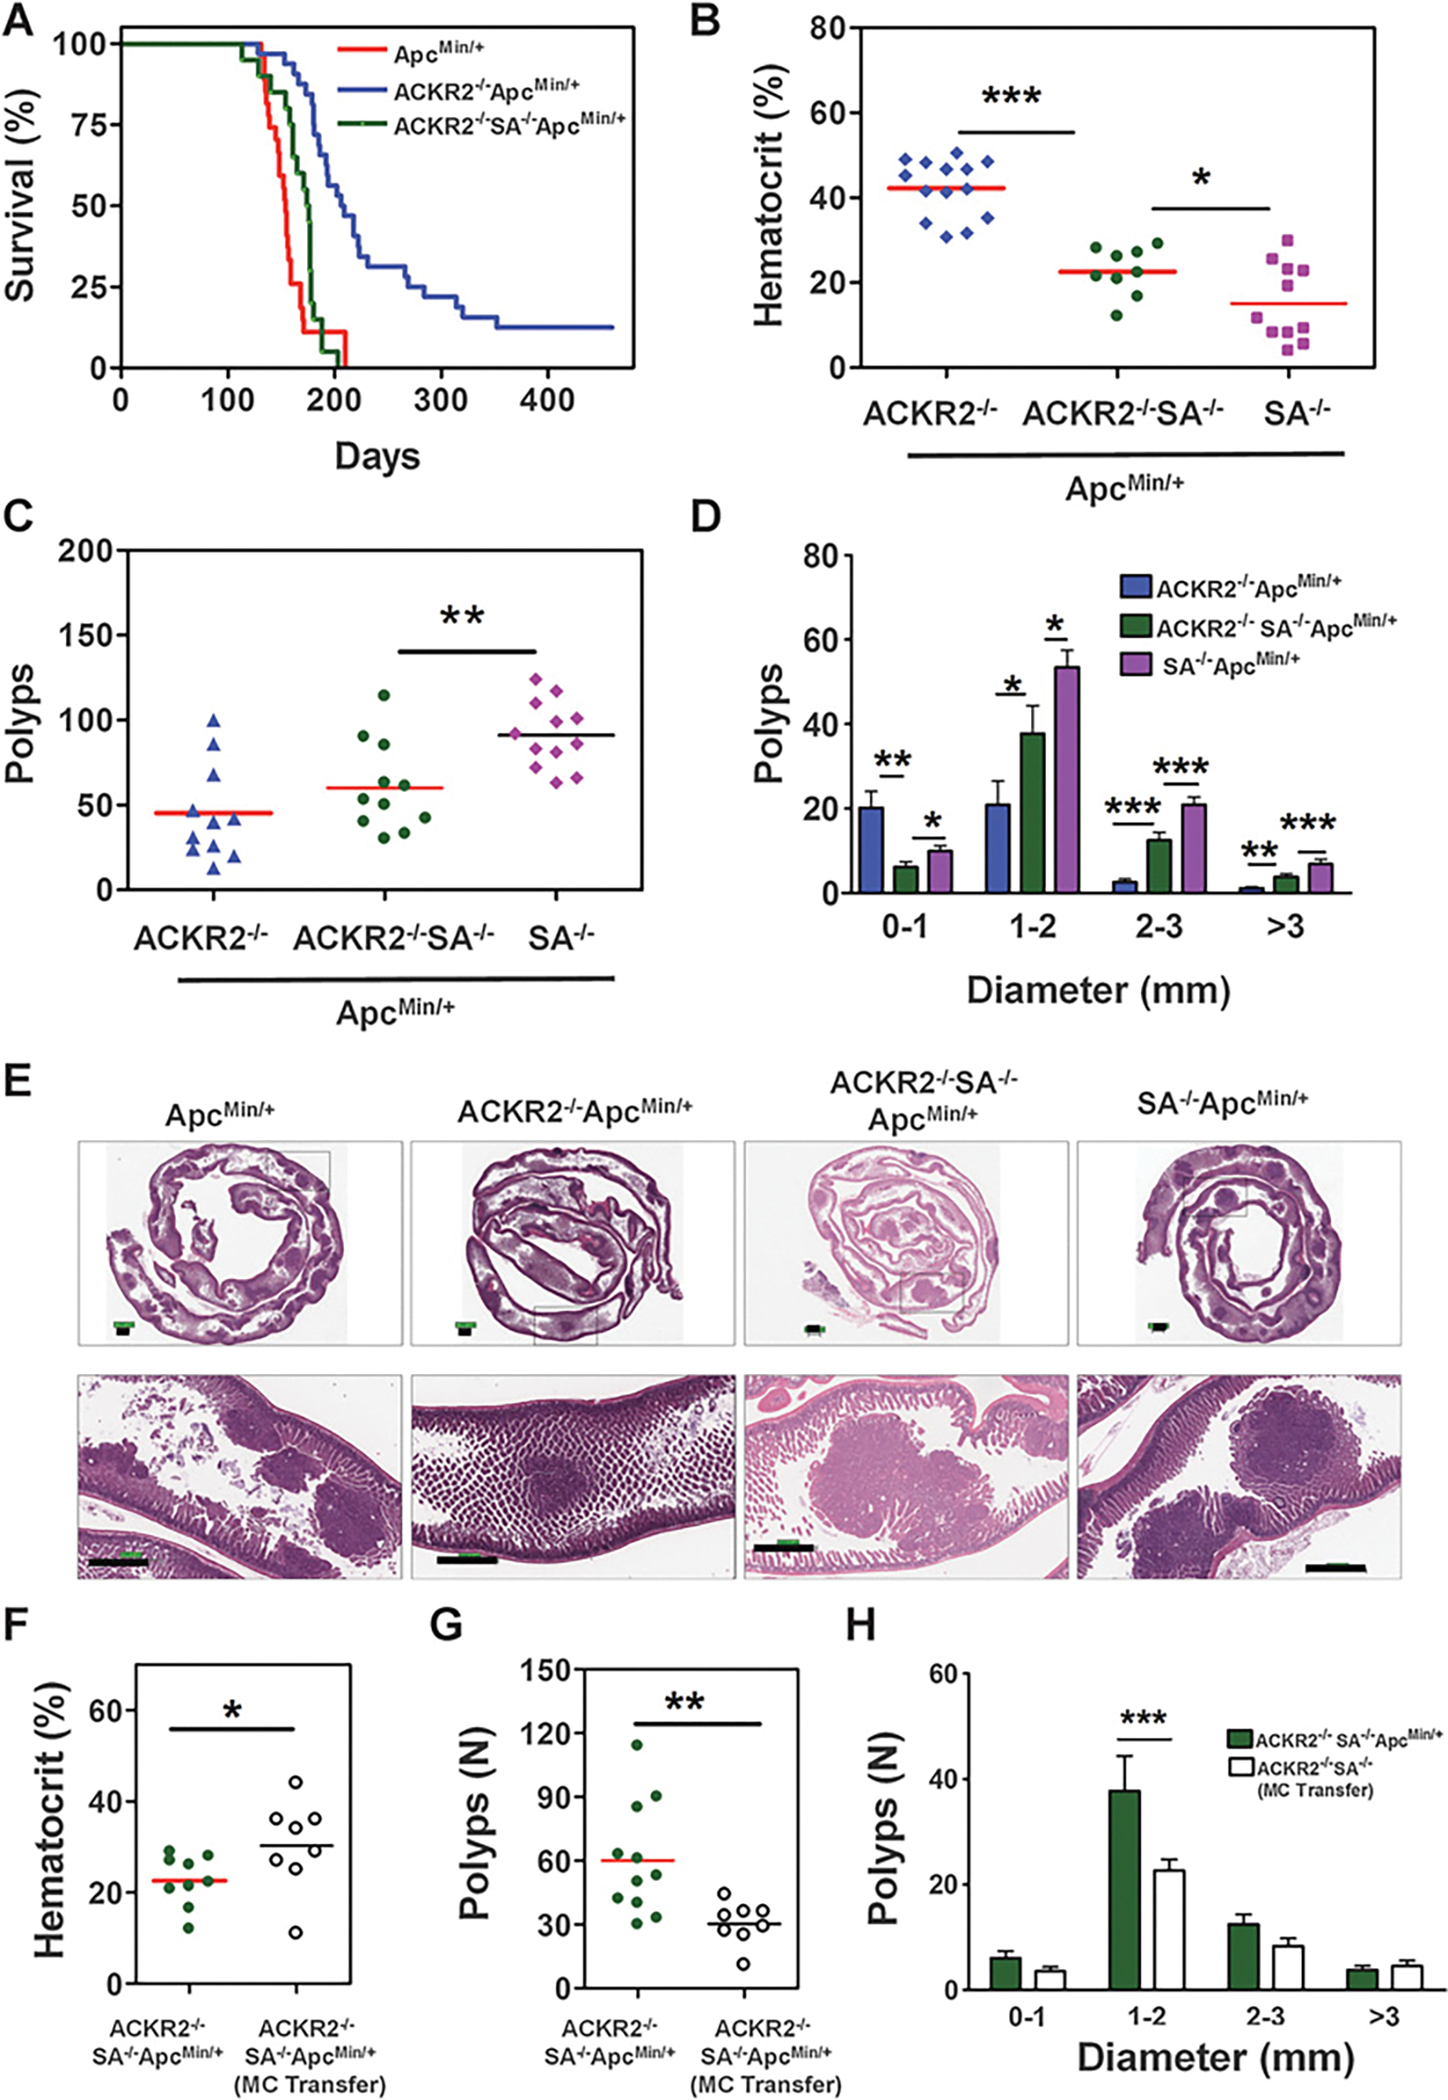
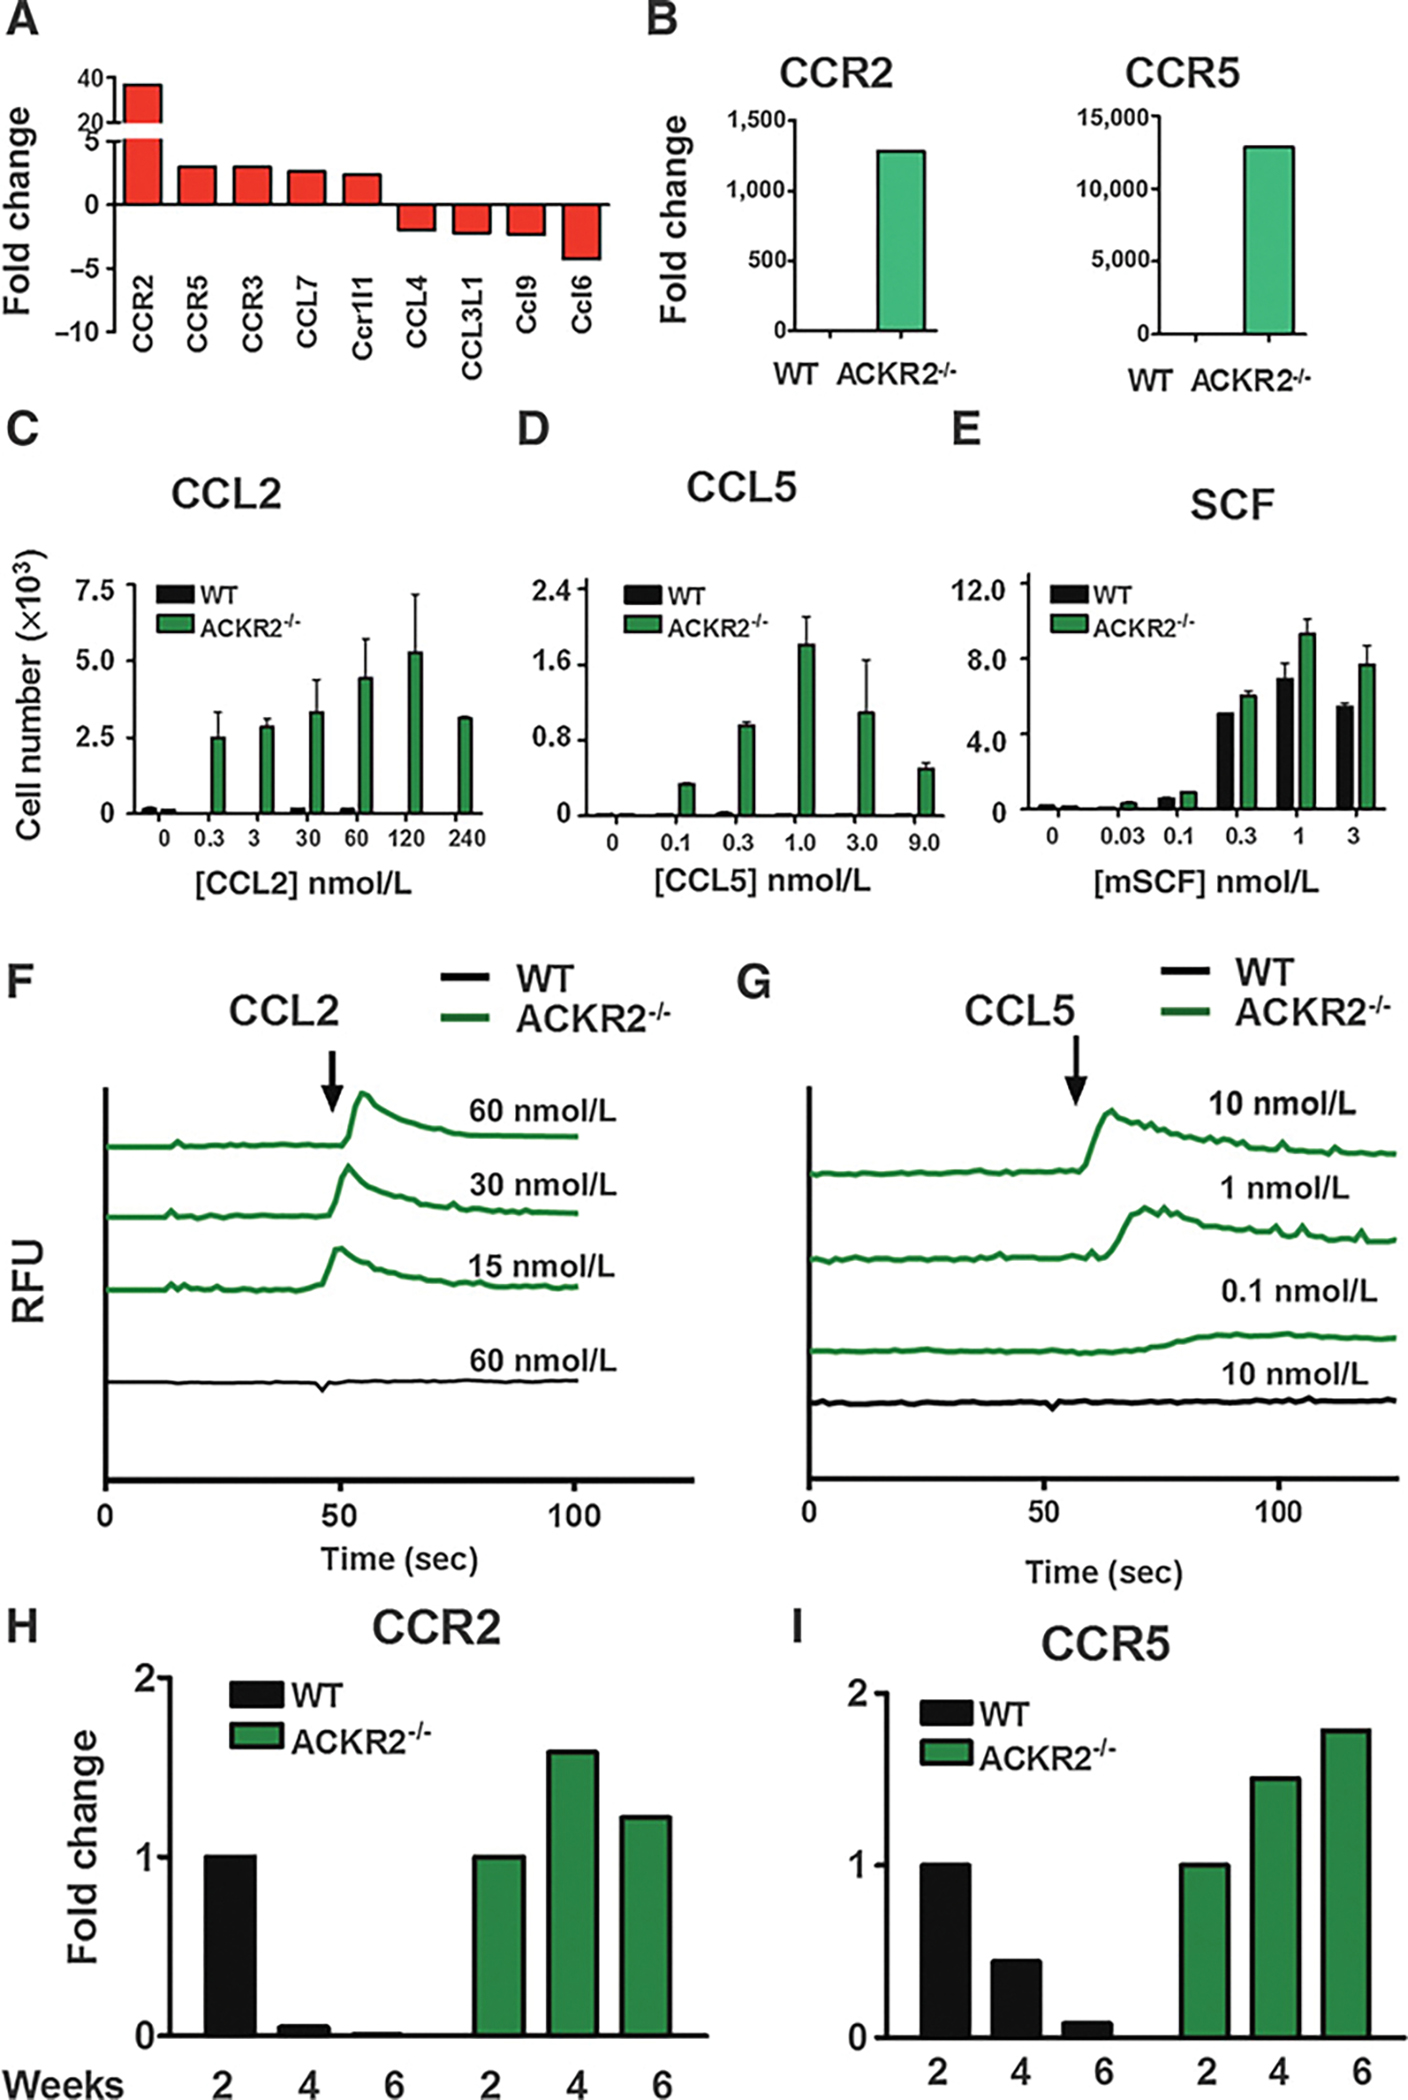
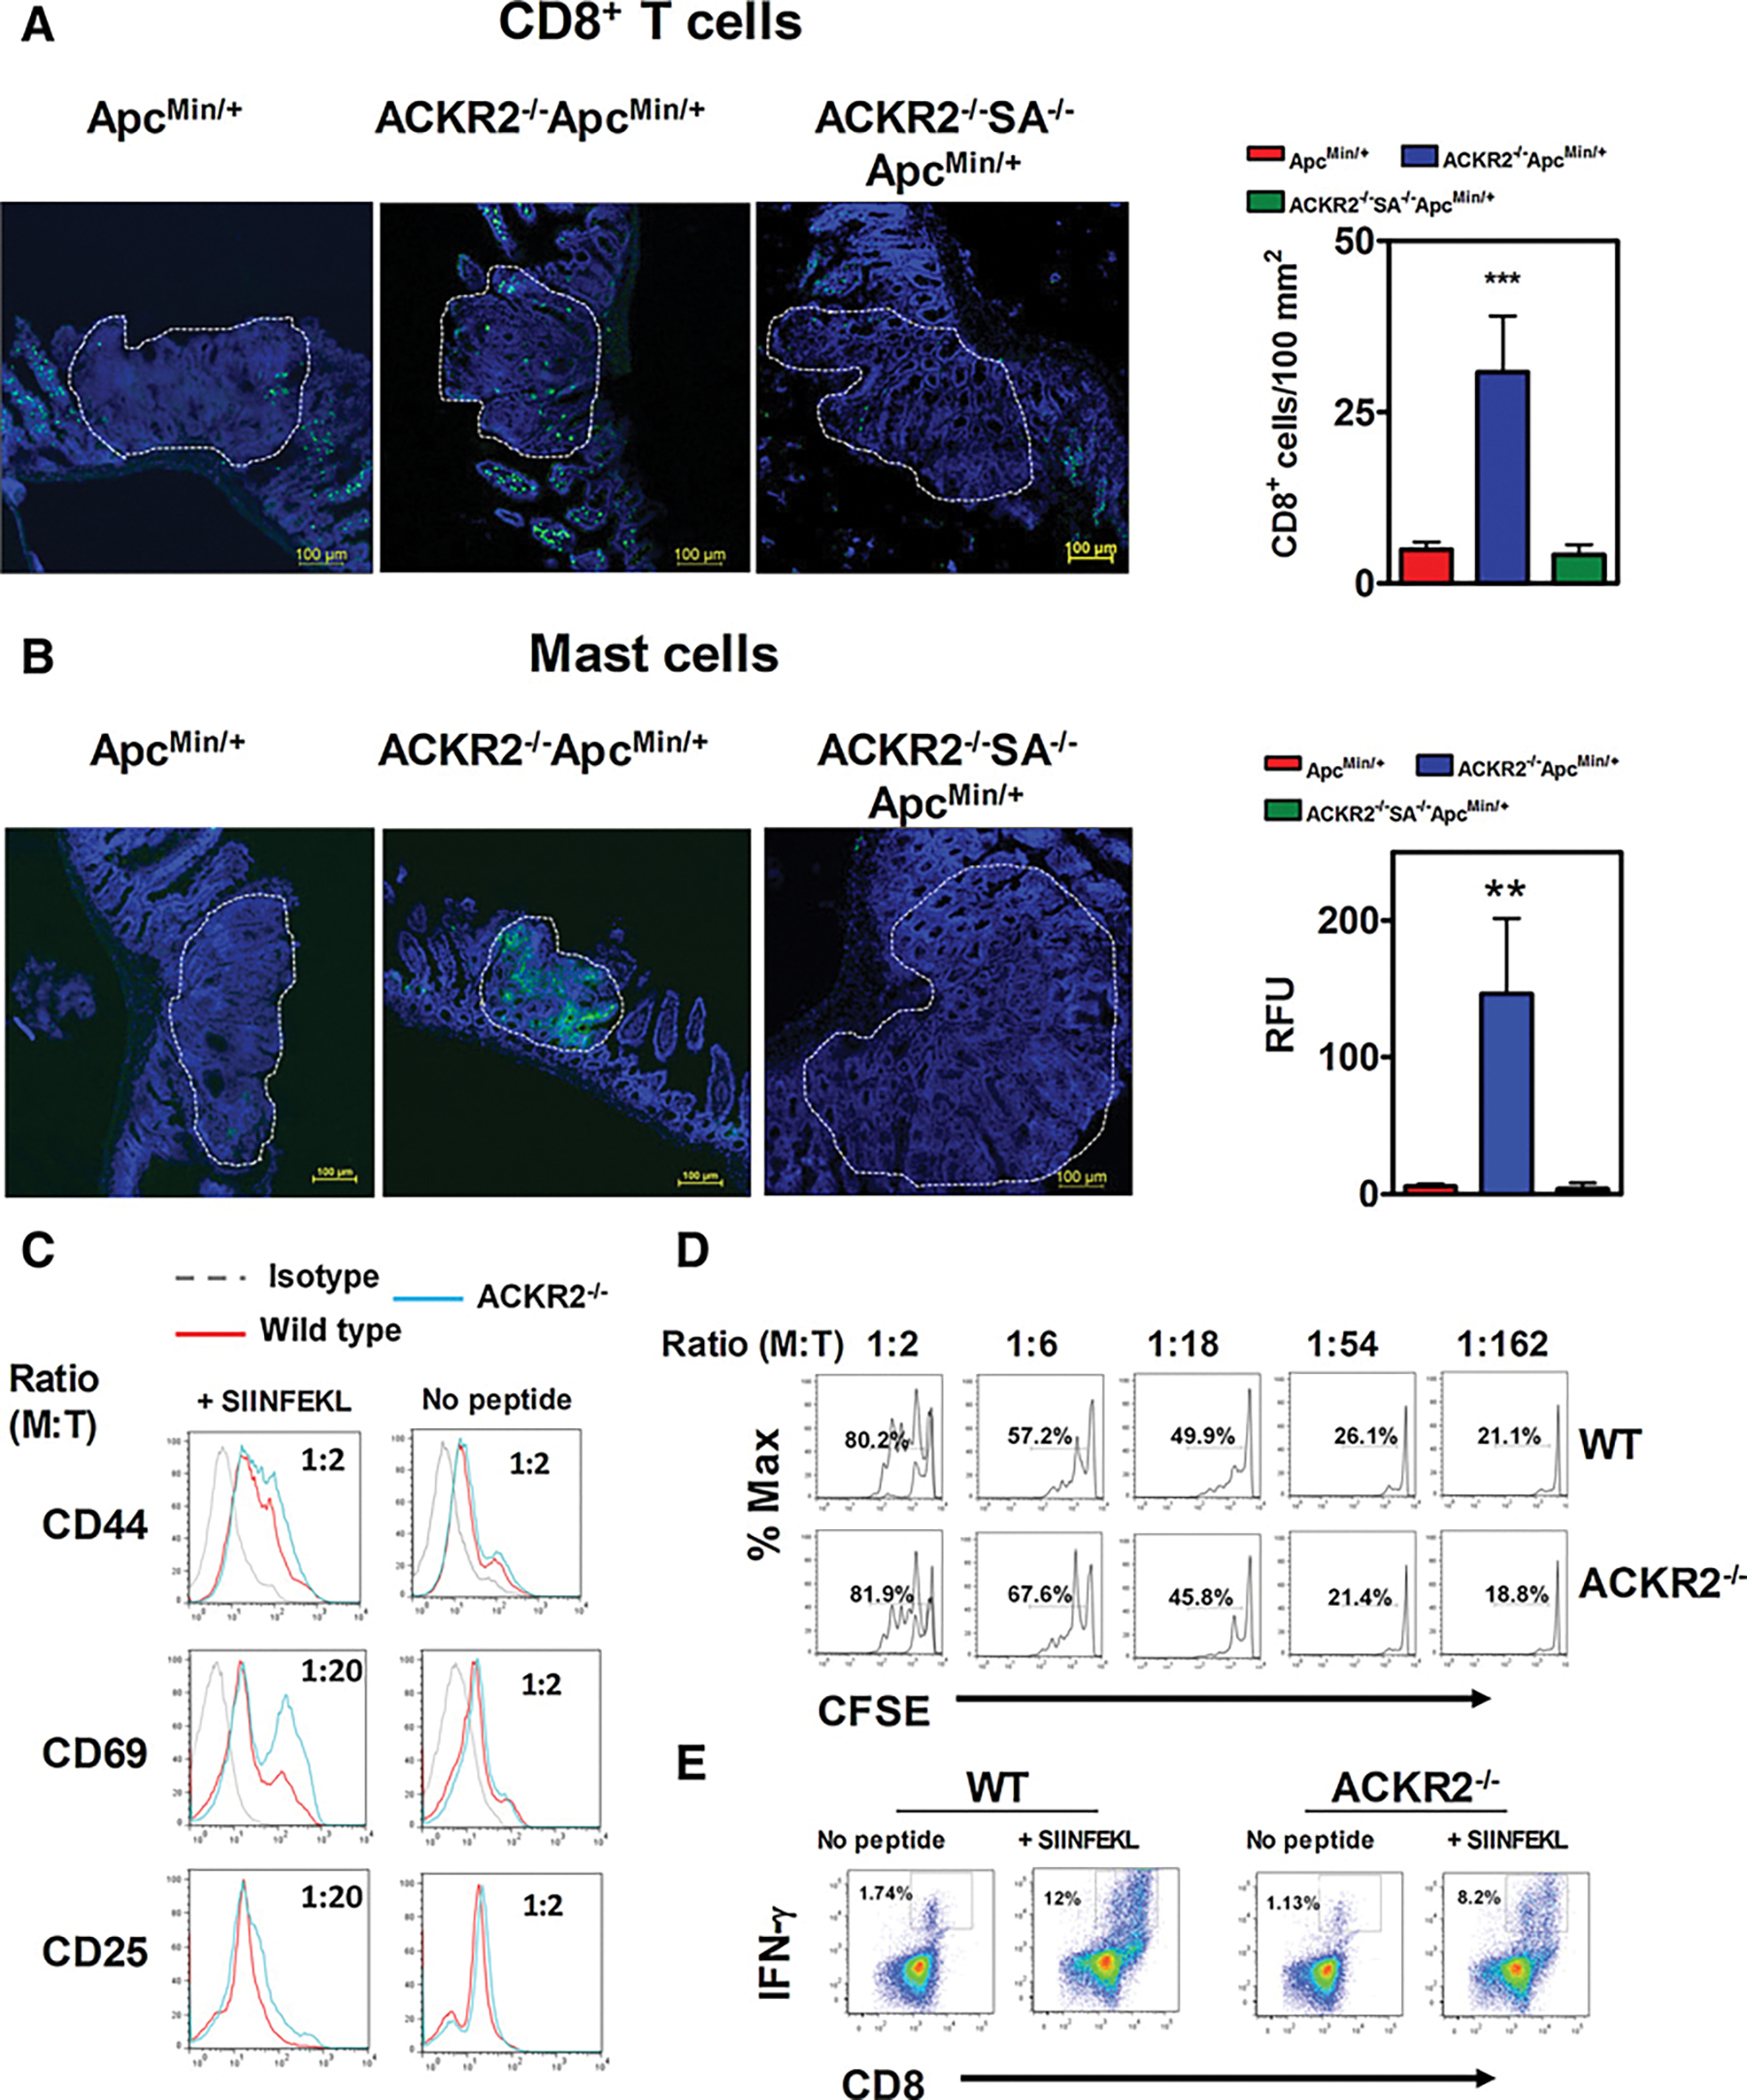
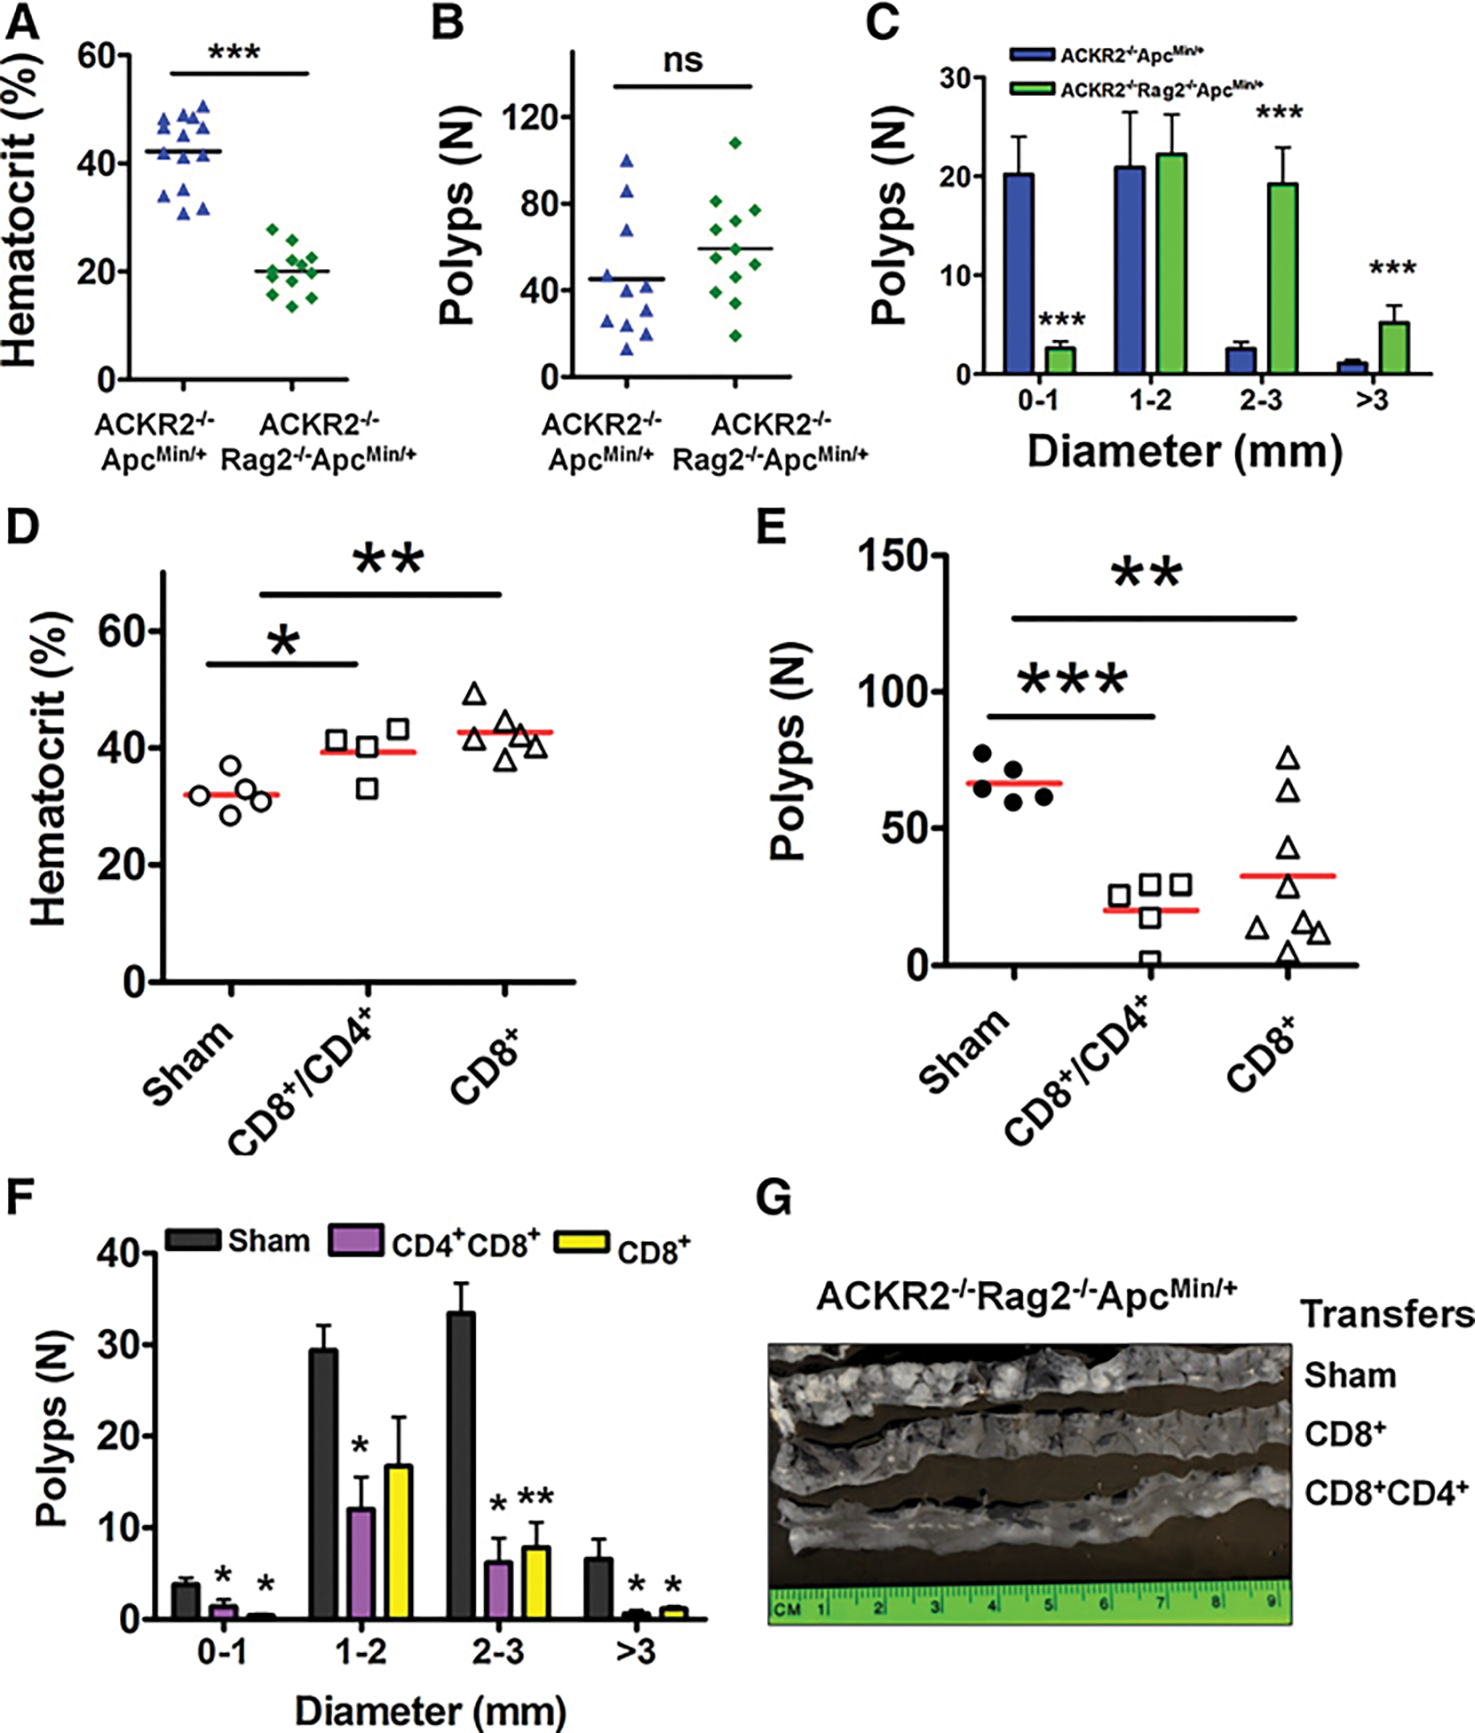
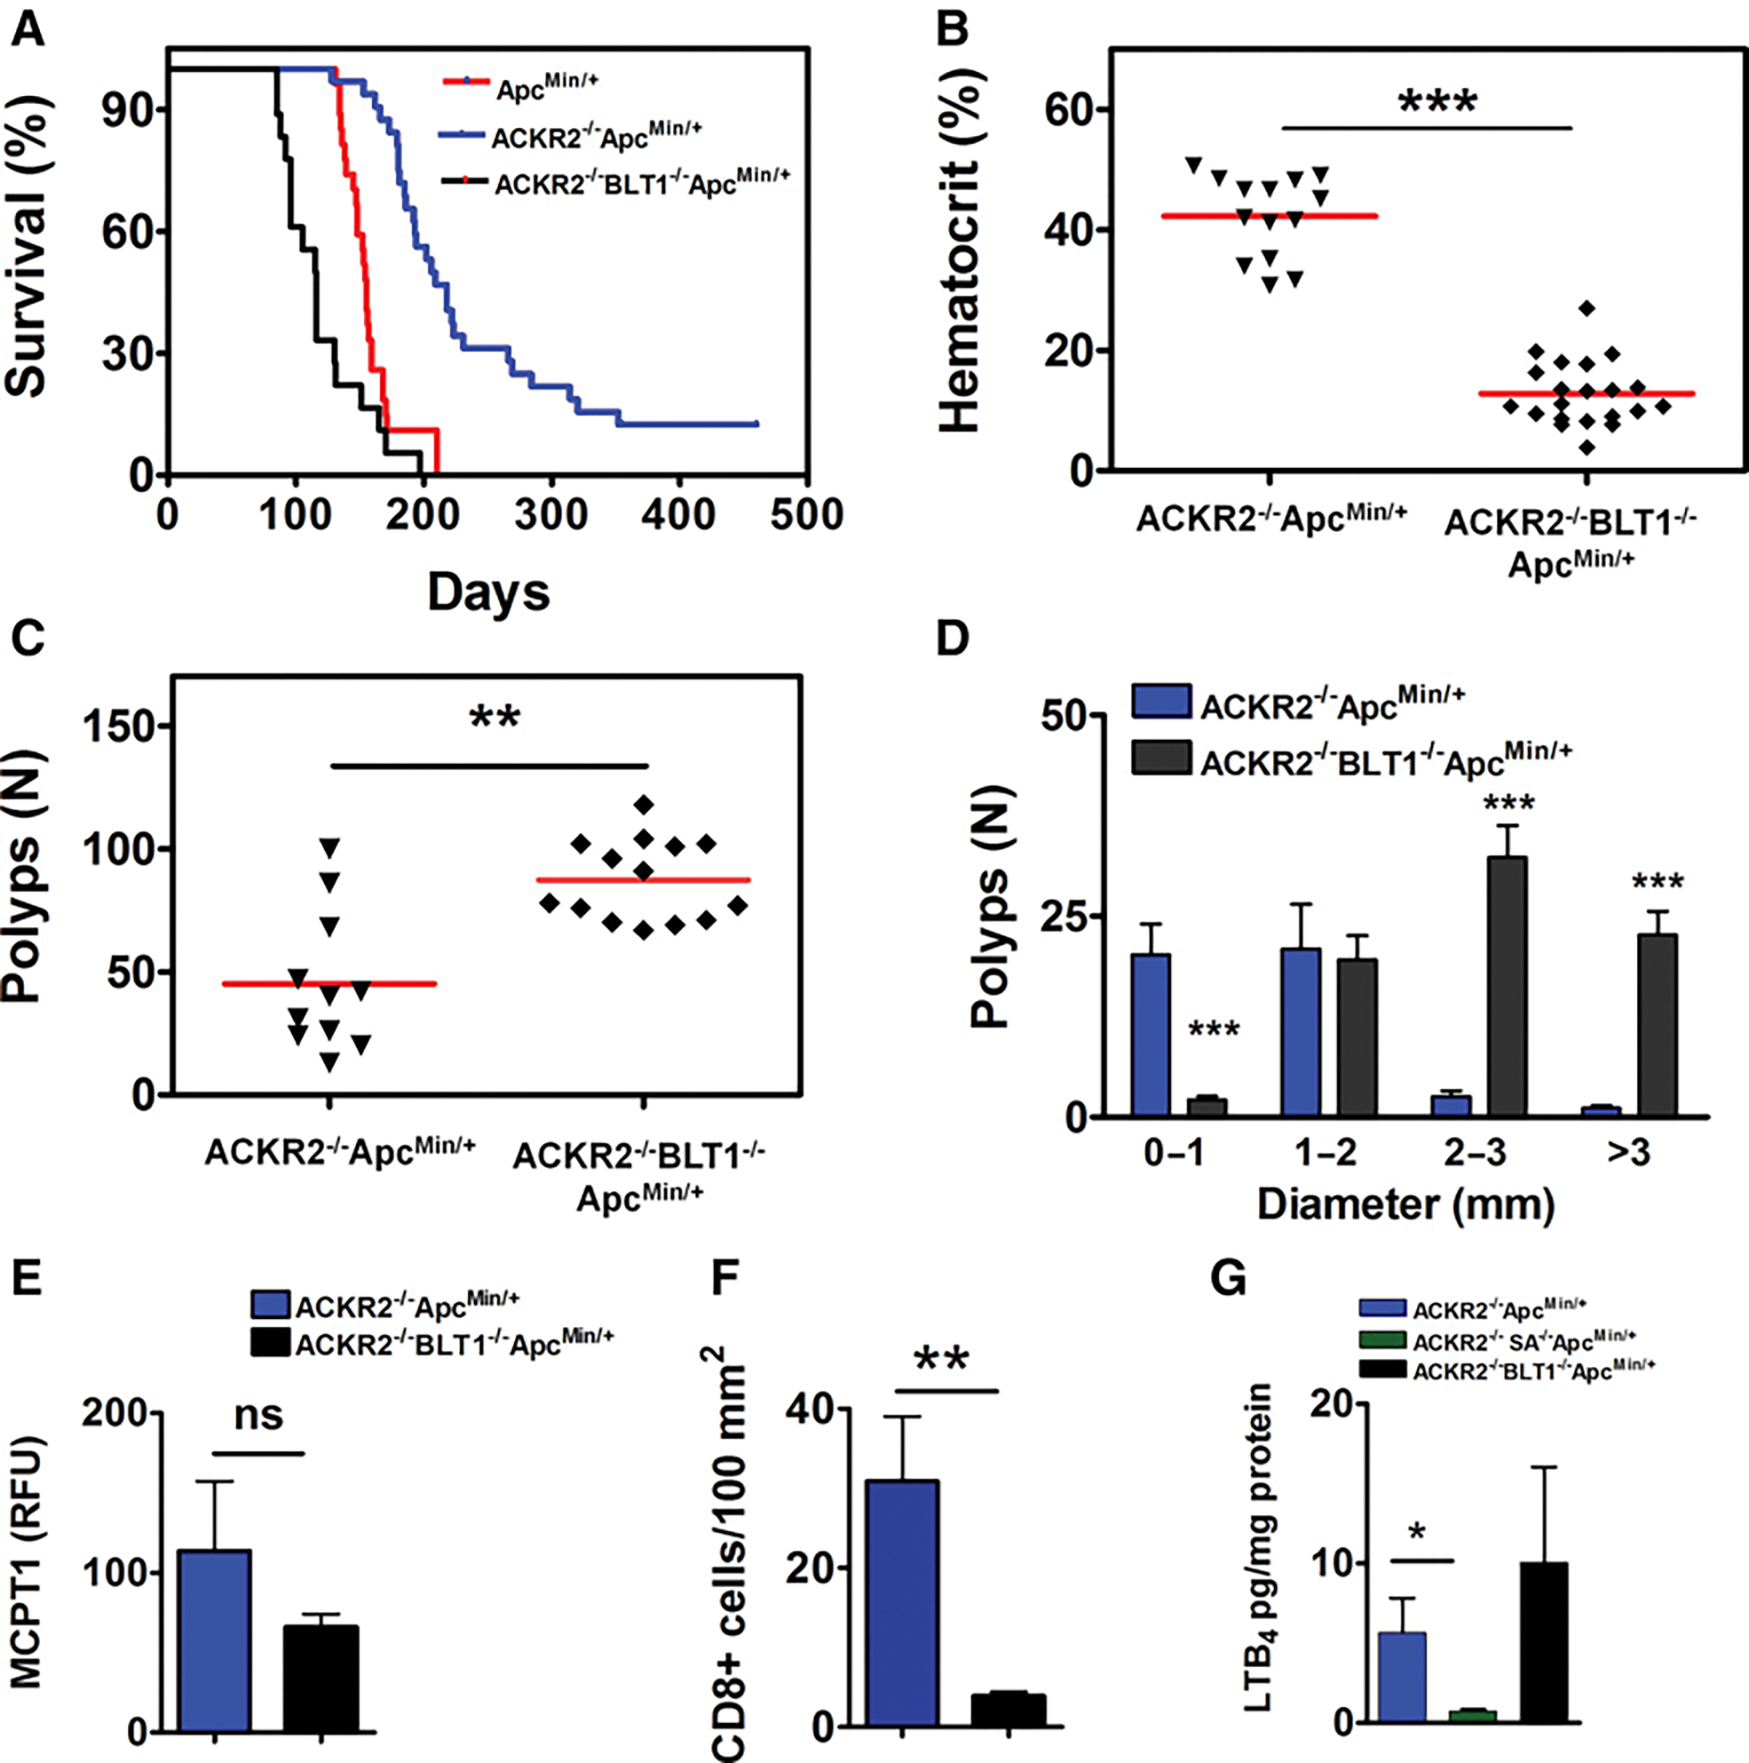
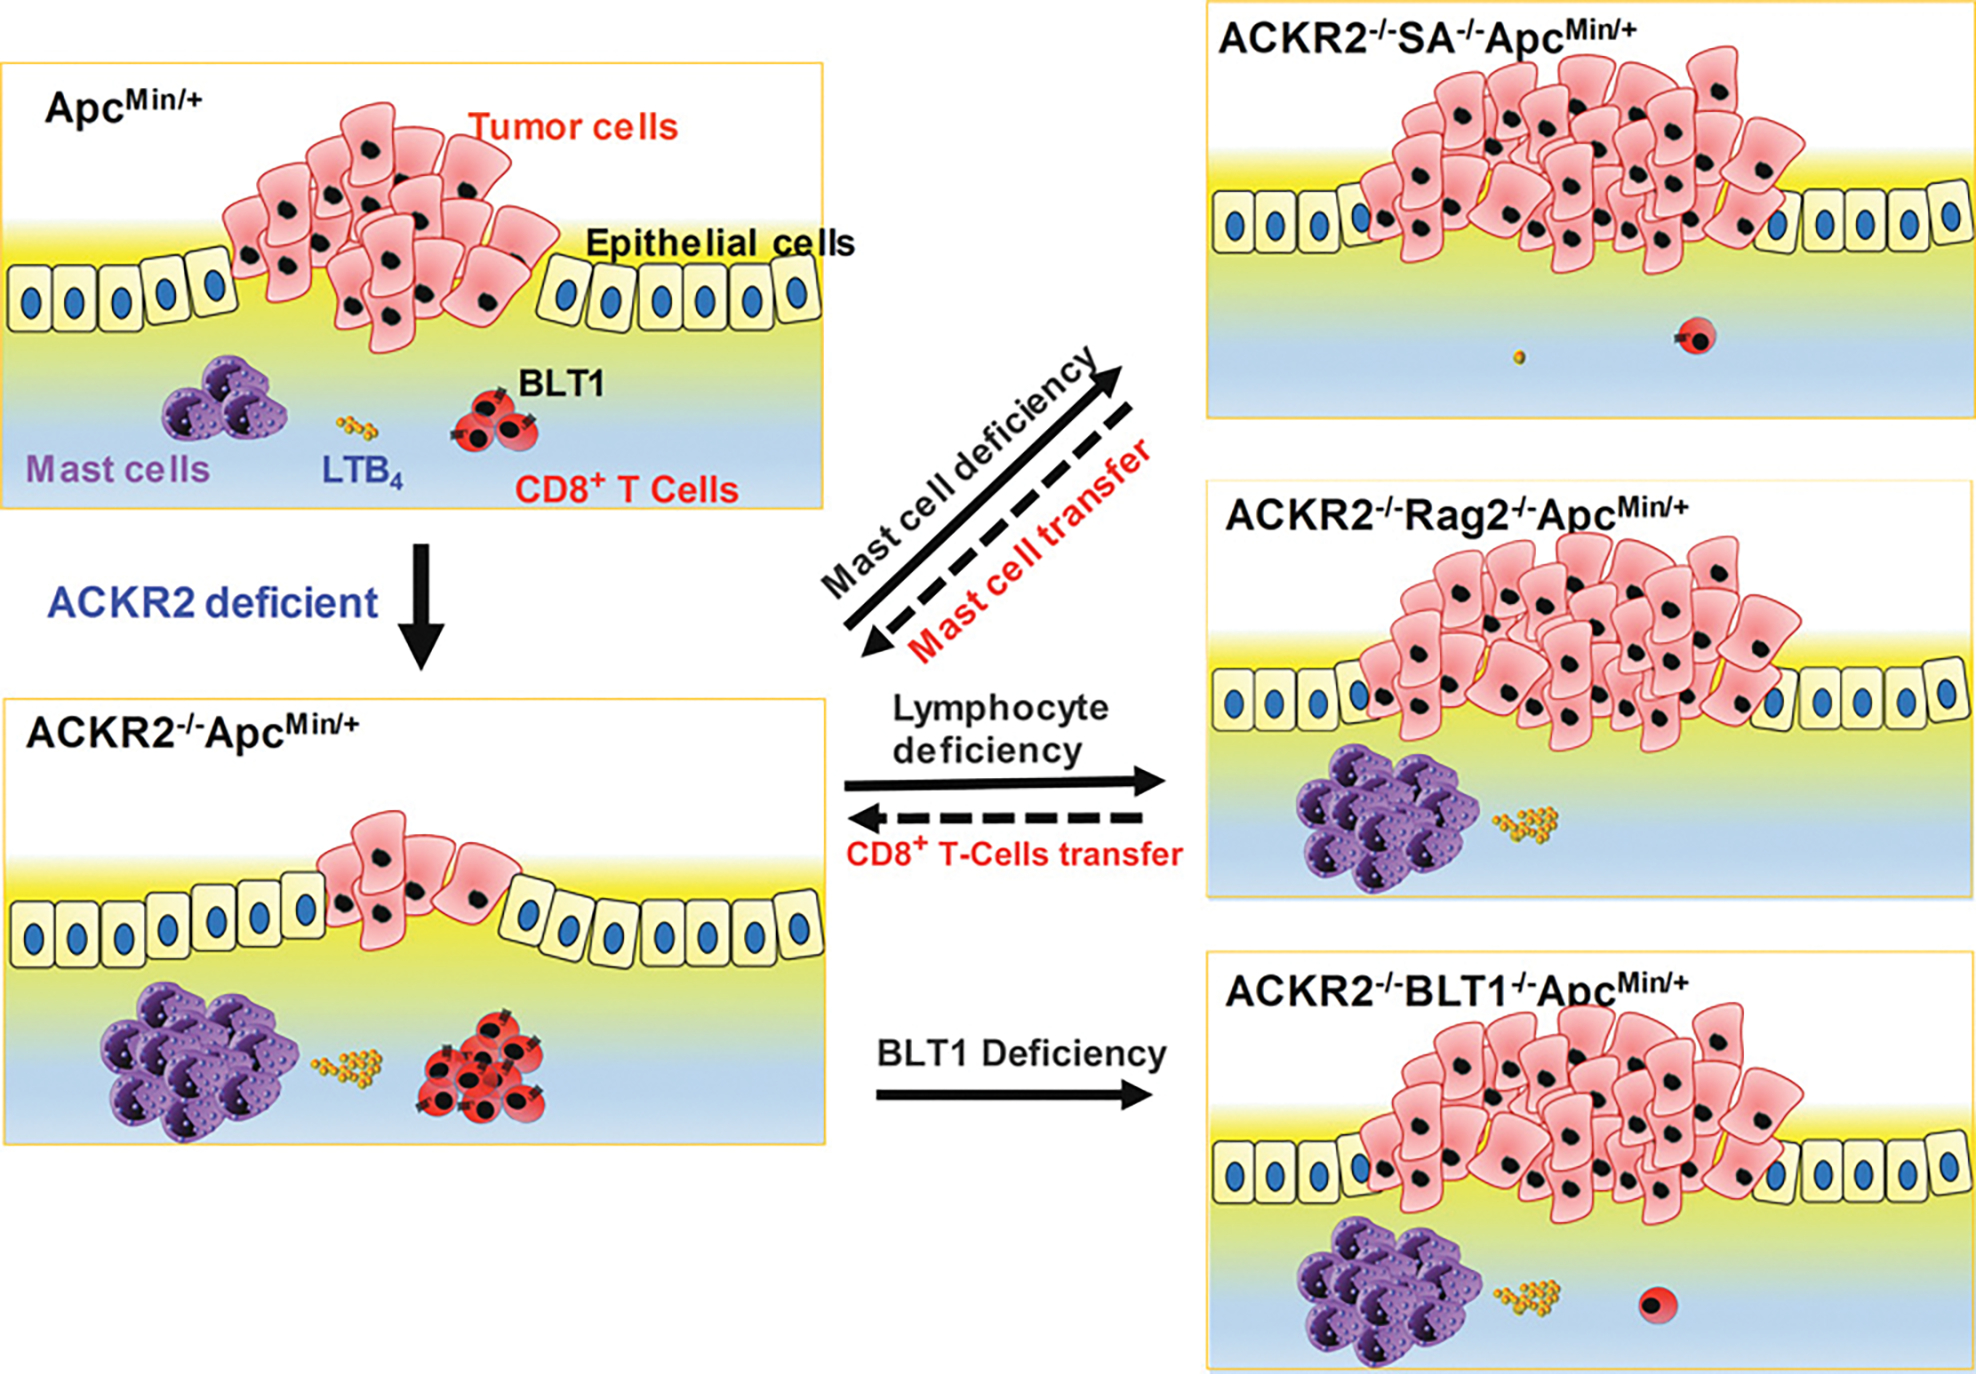
The presence of mast cells in some human colorectal cancers is a positive prognostic factor, but the basis for this association is incompletely understood. Here, we found that mice with a heterozygous mutation in the adenomatous polyposis coli gene (ApcMin/+) displayed reduced intestinal tumor burdens and increased survival in a chemokine decoy receptor, ACKR2-null background, which led to discovery of a critical role for mast cells in tumor defense. ACKR2-/-ApcMin/+ tumors showed increased infiltration of mast cells, their survival advantage was lost in mast cell-deficient ACKR2-/-SA-/-ApcMin/+ mice as the tumors grew rapidly, and adoptive transfer of mast cells restored control of tumor growth. Mast cells from ACKR2-/- mice showed elevated CCR2 and CCR5 expression and were also efficient in antigen presentation and activation of CD8+ T cells. Mast cell-derived leukotriene B4 (LTB4) was found to be required for CD8+ T lymphocyte recruitment, as mice lacking the LTB4 receptor (ACKR2-/-BLT1-/-ApcMin/+) were highly susceptible to intestinal tumor-induced mortality. Taken together, these data demonstrate that chemokine-mediated recruitment of mast cells is essential for initiating LTB4/BLT1-regulated CD8+ T-cell homing and generation of effective antitumor immunity against intestinal tumors. We speculate that the pathway reported here underlies the positive prognostic significance of mast cells in selected human tumors. Cancer Immunol Res; 6(3); 332-47. ©2018 AACR.


Conflict of interest statement

Disclosure of Potential Conflicts of Interest

A. Mantovani is a consultant/advisory board member for Verily, Efranat, AbbVie, Compugen, Novartis, Pierre Fabre, and Roche. No potential conflicts of interest were disclosed by the other authors.

Figures

Figure 1.
Figure 1.
Decreased mortality and tumorigenesis in ACKR2−/−ApcMin+ mice. A, Kaplan–Meier survival plot analysis for ApcMin/+ (n = 27; red), ACKR2+/−ApcMin/+ (n = 20; blue), and ACKR2−/−ApcMin/+ mice (n = 30; green). Significance determined by the Mantel–Haenszel/log-rank test (P < 0.0001). B, Hematocrit values determined in 110-day-old WT (N = 11), ApcMin/+ (n = 14), ACKR2−/−(n = 11), and ACKR2−/−ApcMin/+ (n = 14) mice. C, Total number of polyps in the small intestine quantified by stereoscopic microscopy in age-matched (105–110-day-old) ApcMin/+ (n = 12) and ACKR2−/−ApcMin/+ (n = 11) mice. D, Frequency of polyps in the proximal, middle, and distal regions, and (E) the size distribution of polyps in the small intestine for ApcMin/+ (n = 12) and ACKR2−/−ApcMin/+ (n = 11) mice. F, Representative images of longitudinally opened distal small intestines. FFPE distal intestine tumor sections were analyzed for (G) proliferation (BrdUrd incorporation) and (H) apoptotic cell death (TUNEL assay). Both BrdUrd-positive cells (brown) and apoptotic cells (green) were counted from 20× images of 5–6 tumors from 3 mice per genotype. Error bars, SEM. Scale bar, 100 μm. Statistical analysis performed using Mann–Whitney U test (*, P < 0.05; **, P < 0.01; ***, P < 0.001).
Figure 2.
Figure 2.
Increased mast cell proteases in ACKR2−/−ApcMin+ mice. A, Fold changes in the expression of Mcpt-1 and Mcpt-2 in pooled samples of small intestinal tumors derived from three independent mice compared with WT small intestines. These were derived from pairwise comparisons between ACKR2−/−ApcMin/+, ApcMin/+ mice small intestinal tumors and wild-type normal small intestine tissue. B, Relative fold changes of Mcpt-1 and Mcpt-2 mRNA determined in ACKR2−/−ApcMin/+ and ApcMin/+ tumors compared with wild type normal small intestine tissue by qPCR. Statistical analysis performed using unpaired t test (**, P < 0.01). C, Western blot of distal intestines tissue lysates prepared from either normal tissue (WT, ACKR2−/−) or tumors (ApcMin/+, ACKR2−/−ApcMin/+) using anti-mouse Mcpt-1. The blot was stripped and reprobed for β-actin. The quantification of band intensities was measured using Quantity One 4.0.3 software and expressed as a ratio of Mcpt-1/β-actin signals. D, Immunohistochemical staining of PPFE sections of 110-day-old ApcMin/+ and ACKR2–/–ApcMin/+ mice for mucosal mast cells (red granules) with anti–Mcpt-1 and counterstained with hematoxicillin (blue). Scale bar, 100 μm.
Figure 3.
Figure 3.
Mast cells are critical for tumor protective phenotype of ACKR2−/−ApcMin+ mice. A, Overall survival of ACKR2−/−SA−/−ApcMin/+ (n = 20; green), ApcMin/+ (n = 27; red), and ACKR2−/−ApcMin/+ mice (n = 30; blue) using the Kaplan–Meier method. Significance determined by the Mantel–Haenszel/log-rank test (P < 0.0001). B, Hematocrit values determined in 110-day-old ACKR2−/−ApcMin/+ (n = 14), ACKR2−/−SA−/−ApcMin/+ (n = 9), and SA−/−ApcMin/+ (n = 11) mice. C, Total number and (D) size distribution of polyps in the small intestine of ACKR2−/−ApcMin/+(n = 11), ACKR2−/−SA−/−ApcMin/+(n = 11), and SA−/−ApcMin/+ (n = 12) mice. E, Representative images of H&E-stained cross-sections of distal intestines at indicated magnification. Scale bar, 1 mm. F–H, BMMCs (1 × 10⁷) cultured from ACKR2–/– mice were adoptively transferred i.v. into 4-week-old ACKR2−/−SA−/−ApcMin/+ mice and analyzed for (F) hematocrit, (G) small intestinal polyp number, and (H) size at 100 days of age. Statistical analysis performed using two-tailed Mann–Whitney U test (*, P < 0.05; **, P < 0.01; ***, P < 0.001; NS, not significant).
Figure 4.
Figure 4.
Increased CCR2 and CCR5 expression in ACKR2−/− BMMCs. A, Fold changes in the expression of the top 10 chemokines and chemokine receptors observed by microarray analysis of BMMCs from ACKR2−/− mice compared with WT BMMCs. Total RNA was isolated and pooled from BMMC cultures isolated from three independent mice for each genotype. B, mRNA of CCR2 and CCR5 in 10-week BMMC cultures. C–E, Chemotaxis assays were performed with WT and ACKR2−/− BMMCs for 3 hours with increasing concentrations of (C) CCL2, (D) CCL5, or (E) stem cell factor (SCF). Migrated cells counted by flow cytometry. F and G, Agonist-mediated intracellular calcium release of Indo-1–loaded WT and ACKR2−/− BMMCs at the indicated concentrations of (F) CCL2 or (G) CCL5. The data are representative of 3 independent experiments performed. H and I, Total RNA from BMMCs at different time points (2, 4, 6 weeks) was isolated and mRNA of (H) CCR2 or (I) CCR5 was measured using real-time PCR.
Figure 5.
Figure 5.
CD8+ T-cell infiltration correlates with mast cells’ presence in ACKR2−/−ApcMin/+ tumors. The frozen distal intestine (110 days old) sections were stained with (A) CD8 antibody or (B) Mcpt-1 antibody. Tumor regions: white line; blue, DAPI; green: CD8 (A) or Mcpt-1 (B). Statistical analysis performed using two-tailed Mann–Whitney U test (**, P < 0.01; ***, P < 0.001). Scale bar, 100 μm. C, BMMCs were pulse-loaded with 4 μmol/L SIINFEKEL, washed, and added to MACS purified OT-1 CD8+ T cells at different ratios, as indicated. Cell-surface expression of CD69, CD44, and CD25 on CD8+ T cells was analyzed by flow cytometry. D, BMMCs were pulsed with 4 μmol/L SIINFEKEL, washed, and added to MACS purified, CFSE-labeled OT-1 CD8+ T cells at different ratios with 1 × 10⁶ CD8+ T cells. Proliferation was analyzed by flow cytometry. The overlay in the 1:2 ratio shows the addition of the same number of mast cells without the peptide on their surface. E, WT and ACKR2−/− BMMC-mediated IFNγ production in CD8+ T cells. SIINFEKL pulsed BMMCs were cocultured with MACS purified OT-1 CD8+ T cells at 1:2 ratio for 48 hours and then stimulated with PMA/ionomycin cocktail for 5 hours and analyzed for intracellular IFNγ levels by flow cytometry.
Figure 6.
Figure 6.
T cell–mediated protection against tumor development in ACKR2−/−ApcMin/+ mice. Comparison of (A) hematocrit values, (B) small intestine polyp number, and (C) size distribution between ACKR2−/−ApcMin/+ (n = 11) and ACKR2−/−Rag2−/−ApcMin/+ (n = 12) mice. D–G, ACKR2−/−Rag2−/−ApcMin/+ mice at 35 days of age received either i.v. PBS (sham), 8.5 × 10⁵ CD8+ T cells, or the same number of CD4+ and CD8+ T cells (1:1) isolated from ACKR2−/−ApcMin/+ mice. D, Hematocrit values, (E) small intestine polyp number, and (F) size distribution at 110 days age in adoptively transferred mice. G, Representative images of longitudinally opened distal small intestines of transferred and nontransferred ACKR2−/−Rag2−/−ApcMin/+ mice. Statistical analysis performed using Mann–Whitney U test (*, P < 0.05; **, P < 0.01; ***, P < 0.001; NS not significant).
Figure 7.
Figure 7.
Antitumor activity in ACKR2−/−ApcMin/+ mice requires BLT1. A, Kaplan–Meier survival curves for ApcMin/+ (n = 28), ACKR2−/−ApcMin/+ (n = 28), and BLT1−/vACKR2−/−ApcMin/+ (n = 18) mice. B, Hematocrit values, (C) polyp number, and (D) size of polyps of ACKR2−/−ApcMin/+ and BLT1−/−ACKR2−/−ApcMin/+ mice. E, Number of Mcpt-1+ cells in the tumors of indicated mice quantified using confocal immunofluorescence images. F, Number of tumor-infiltrating CD8+ T cells from at least 6 tumors in each genotype. G, LTB4 levels in tumor homogenates prepared from 5 to 6 distal intestine tumors. Data in E and F represent 3 different mice per genotype. Statistical analysis was performed using Mann–Whitney U test (*, P < 0.05; **, P < 0.01; ***, P < 0.001; NS, not significant).
Figure 8.
Figure 8.
A model for mast cell–mediated immune surveillance of intestinal tumors. Absence of ACKR2 in the background of ApcMin/+ results in mast cell accumulation in the small intestinal tumors and enhanced the survival of mice. Deletion of mast cells accelerates the tumor growth that is partially reversed by adoptively transferred mast cells. Deletion of lymphocytes in Rag2−/− mice also accelerates tumor growth in ACKR2−/−ApcMin/+ mice. Mast cell–produced LTB4 facilitates recruitment of effector CD8+ T cells into adenomas curbing their growth.

Similar articles

Cited by

References

    1. Galli SJ, Tsai M. Mast cells in allergy and infection: versatile effector and regulatory cells in innate and adaptive immunity. Eur J Immunol 2010; 40:1843–51. - PMC - PubMed
    1. Marichal T, Tsai M, Galli SJ. Mast cells: potential positive and negative roles in tumor biology. Cancer Immunol Res 2013;1:269–79. - PubMed
    1. Ribatti D, Crivellato E. Mast cells, angiogenesis, and tumour growth. Biochim Biophys Acta 2012;1822:2–8. - PubMed
    1. Gulubova M, Vlaykova T. Prognostic significance of mast cell number and microvascular density for the survival of patients with primary colorectal cancer. J Gastroenterol Hepatol 2009;24:1265–75. - PubMed
    1. Tan SY, Fan Y, Luo HS, Shen ZX, Guo Y, Zhao LJ. Prognostic significance of cell infiltrations of immunosurveillance in colorectal cancer. World J Gastroenterol 2005;11:1210–4. - PMC - PubMed

Publication types

MeSH terms

Substances